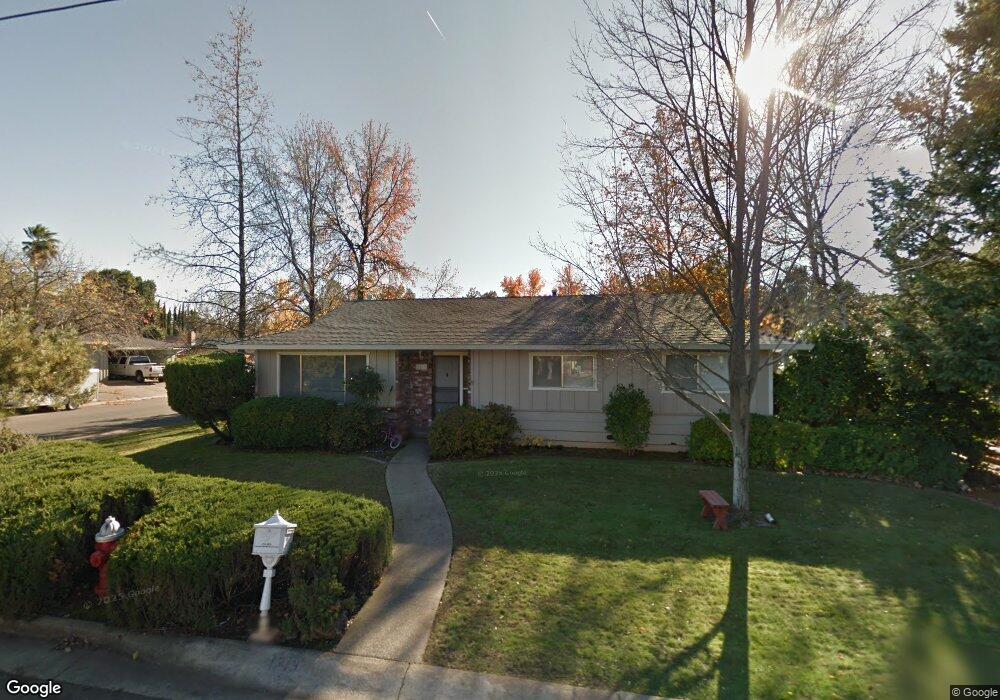
1219 Denton Way Redding, CA 96002
Enterprise NeighborhoodEstimated Value: $348,000 - $417,960
3
Beds
2
Baths
1,870
Sq Ft
$201/Sq Ft
Est. Value
About This Home
This home is located at 1219 Denton Way, Redding, CA 96002 and is currently estimated at $374,987, approximately $200 per square foot. 1219 Denton Way is a home located in Shasta County with nearby schools including Lassen View Elementary School, Parsons Junior High School, and Enterprise High School.
Ownership History
Date
Name
Owned For
Owner Type
Purchase Details
Closed on
Apr 29, 2004
Sold by
Catelli Frank
Bought by
Sharp Sharon
Current Estimated Value
Purchase Details
Closed on
Mar 16, 2000
Sold by
Catelli Frank
Bought by
Frank & Velma Catelli Joint Living Trust
Home Financials for this Owner
Home Financials are based on the most recent Mortgage that was taken out on this home.
Original Mortgage
$86,000
Interest Rate
8.26%
Mortgage Type
Purchase Money Mortgage
Purchase Details
Closed on
Mar 3, 2000
Sold by
Robert E & Helen C Tr Nagel Family Revocable
Bought by
Catelli Frank
Home Financials for this Owner
Home Financials are based on the most recent Mortgage that was taken out on this home.
Original Mortgage
$86,000
Interest Rate
8.26%
Mortgage Type
Purchase Money Mortgage
Purchase Details
Closed on
Oct 1, 1997
Sold by
Nagel Robert E and Nagel Helen C
Bought by
Nagel Robert Ervin and Nagel Helen Carol
Create a Home Valuation Report for This Property
The Home Valuation Report is an in-depth analysis detailing your home's value as well as a comparison with similar homes in the area
Home Values in the Area
Average Home Value in this Area
Purchase History
| Date | Buyer | Sale Price | Title Company |
|---|---|---|---|
| Sharp Sharon | -- | -- | |
| Frank & Velma Catelli Joint Living Trust | -- | -- | |
| Catelli Frank | $128,000 | Placer Title Company | |
| Nagel Robert Ervin | -- | -- |
Source: Public Records
Mortgage History
| Date | Status | Borrower | Loan Amount |
|---|---|---|---|
| Previous Owner | Catelli Frank | $86,000 |
Source: Public Records
Tax History
| Year | Tax Paid | Tax Assessment Tax Assessment Total Assessment is a certain percentage of the fair market value that is determined by local assessors to be the total taxable value of land and additions on the property. | Land | Improvement |
|---|---|---|---|---|
| 2025 | $2,151 | $47,325 | $30,727 | $16,598 |
| 2024 | $2,121 | $192,852 | $30,125 | $162,727 |
| 2023 | $2,121 | $189,072 | $29,535 | $159,537 |
| 2022 | $2,061 | $185,365 | $28,956 | $156,409 |
| 2021 | $1,991 | $181,732 | $28,389 | $153,343 |
| 2020 | $1,982 | $179,869 | $28,098 | $151,771 |
| 2019 | $1,966 | $176,344 | $27,548 | $148,796 |
| 2018 | $1,943 | $172,887 | $27,008 | $145,879 |
| 2017 | $1,978 | $169,498 | $26,479 | $143,019 |
| 2016 | $1,850 | $166,175 | $25,960 | $140,215 |
| 2015 | $1,835 | $163,680 | $25,571 | $138,109 |
| 2014 | $1,822 | $160,475 | $25,071 | $135,404 |
Source: Public Records
Map
Nearby Homes
- 4302 Paulson Ln
- 4323 Churn Crk Rd
- 3703 Harrow Ct
- 751 Woodacre Dr
- 1513 Harpole Rd
- 1354 Harpole Rd
- 723 Woodacre Dr
- 1289 Arizona St
- 4724 Squirrel Run Ct
- 607 Woodacre Dr
- 4877 Squirrel Run Ct
- 737 Estate St
- 688 Julie Way
- 3708 Traverse St
- 4624 Columbine Dr
- 3527 Adams Ln
- 4487 Alta Saga Dr
- 952 Camino Ct
- 4608 Dandelion Dr
- 99999 Churn Creek Rd
- 1201 Denton Way
- 4192 Nelson Dr Unit 1
- 4192 Nelson Dr Unit 3
- 1243 Denton Way
- 1202 Dominion Dr
- 1183 Denton Way
- 1216 Denton Way
- 4191 Nelson Dr
- 1234 Denton Way
- 1180 Denton Way
- 1186 Dominion Dr
- 1261 Denton Way Unit 1
- 1167 Denton Way
- 1252 Denton Way
- 1264 Dominion Dr
- 0000 Expired
- 1168 Dominion Dr
- 1270 Denton Way
- 1215 Ledell Dr
- 4230 Nelson Dr
Your Personal Tour Guide
Ask me questions while you tour the home.