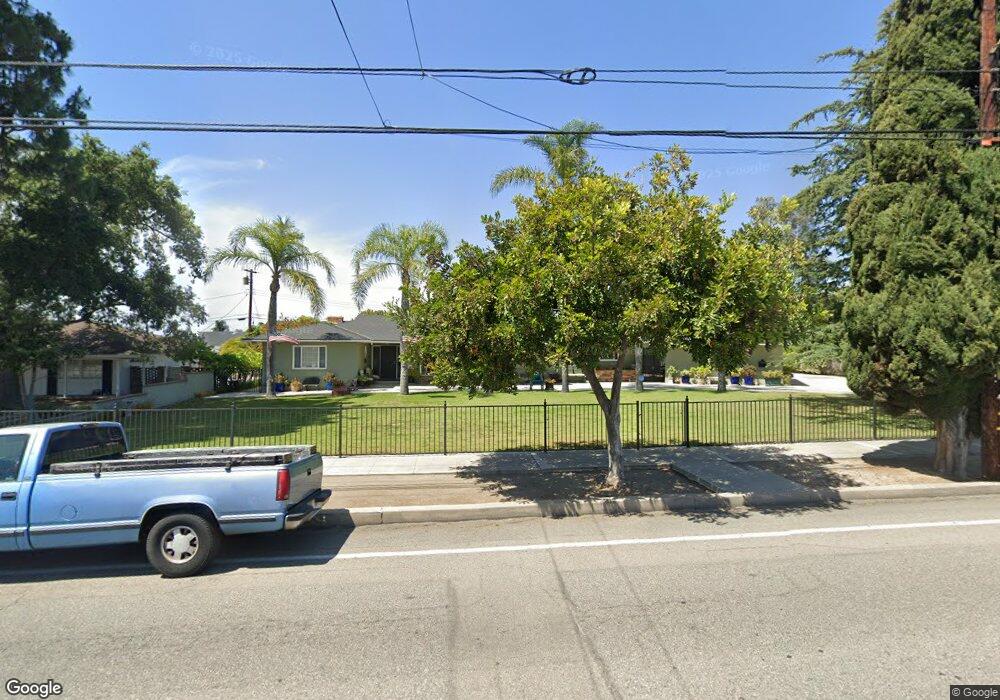
1219 E Walnut Ave Orange, CA 92867
Estimated Value: $1,295,000 - $1,868,000
3
Beds
2
Baths
2,420
Sq Ft
$632/Sq Ft
Est. Value
About This Home
This home is located at 1219 E Walnut Ave, Orange, CA 92867 and is currently estimated at $1,529,175, approximately $631 per square foot. 1219 E Walnut Ave is a home located in Orange County with nearby schools including Cambridge Elementary School, Yorba Middle School, and Orange High School.
Ownership History
Date
Name
Owned For
Owner Type
Purchase Details
Closed on
Feb 17, 2012
Sold by
Chomyn Miron B and Chomyn Janet L
Bought by
Chomyn Miron B and Chomyn Janet L
Current Estimated Value
Purchase Details
Closed on
Sep 22, 2006
Sold by
The Guttenbeil Family Trust
Bought by
Chomyn Miron B and Chomyn Janet L
Home Financials for this Owner
Home Financials are based on the most recent Mortgage that was taken out on this home.
Original Mortgage
$275,000
Outstanding Balance
$163,250
Interest Rate
6.46%
Mortgage Type
Purchase Money Mortgage
Estimated Equity
$1,365,925
Purchase Details
Closed on
Dec 23, 2004
Sold by
Guttenbeil Gerhardt and Guttenbeil Anita
Bought by
Guttenbeil Gerhardt and Guttenbeil Anita
Purchase Details
Closed on
Oct 17, 2000
Sold by
Weltmer Robert E and Weltmer Mary P
Bought by
Guttenbeil Gerhardt and Guttenbeil Anita
Home Financials for this Owner
Home Financials are based on the most recent Mortgage that was taken out on this home.
Original Mortgage
$292,000
Interest Rate
7.5%
Create a Home Valuation Report for This Property
The Home Valuation Report is an in-depth analysis detailing your home's value as well as a comparison with similar homes in the area
Home Values in the Area
Average Home Value in this Area
Purchase History
| Date | Buyer | Sale Price | Title Company |
|---|---|---|---|
| Chomyn Miron B | -- | Accommodation | |
| Chomyn Miron B | $884,000 | First American Title Co | |
| Guttenbeil Gerhardt | -- | -- | |
| Guttenbeil Gerhardt | $365,000 | Commonwealth Land Title |
Source: Public Records
Mortgage History
| Date | Status | Borrower | Loan Amount |
|---|---|---|---|
| Open | Chomyn Miron B | $275,000 | |
| Previous Owner | Guttenbeil Gerhardt | $292,000 |
Source: Public Records
Tax History
| Year | Tax Paid | Tax Assessment Tax Assessment Total Assessment is a certain percentage of the fair market value that is determined by local assessors to be the total taxable value of land and additions on the property. | Land | Improvement |
|---|---|---|---|---|
| 2025 | $7,191 | $663,008 | $595,822 | $67,186 |
| 2024 | $7,191 | $650,008 | $584,139 | $65,869 |
| 2023 | $7,031 | $637,263 | $572,685 | $64,578 |
| 2022 | $6,894 | $624,768 | $561,456 | $63,312 |
| 2021 | $6,700 | $612,518 | $550,447 | $62,071 |
| 2020 | $6,638 | $606,238 | $544,803 | $61,435 |
| 2019 | $6,553 | $594,351 | $534,120 | $60,231 |
| 2018 | $6,452 | $582,698 | $523,648 | $59,050 |
| 2017 | $6,182 | $571,273 | $513,380 | $57,893 |
| 2016 | $6,062 | $560,072 | $503,314 | $56,758 |
| 2015 | $5,973 | $551,660 | $495,754 | $55,906 |
| 2014 | $5,844 | $540,854 | $486,043 | $54,811 |
Source: Public Records
Map
Nearby Homes
- 1107 E Sycamore Ave
- 365 N Magnolia St
- 1314 E Hickory Ln
- 552 N Cambridge St
- 1334 E Mayfair Ave
- 1344 E Mayfair Ave
- 1241 E Mayfair Ave
- 1514 E Palm Ave
- 1324 E Lomita Ave
- 375 N Harwood St
- 1124 E Maplewood Place
- 622 E Lomita Ave
- 155 N Cleveland St
- 2206 E Martha Ave
- 560 N Grand St
- 155 S Lincoln St
- 1243 E Almond Ave
- 1801 E Collins Ave Unit 42
- 380 N Sacramento St
- 918 N Cleveland St
- 1275 E Walnut Ave
- 1224 E Madison Ave
- 1209 E Walnut Ave
- 1210 E Madison Ave
- 1240 E Madison Ave
- 1222 E Walnut Ave
- 1232 E Walnut Ave
- 1212 E Walnut Ave
- 1144 E Madison Ave
- 1242 E Walnut Ave
- 1133 E Walnut Ave
- 1305 E Walnut Ave
- 1306 E Madison Ave
- 1221 E Madison Ave
- 1235 E Madison Ave
- 1205 E Madison Ave
- 1128 E Madison Ave
- 1200 E Walnut Ave
- 1315 E Walnut Ave
- 1316 E Madison Ave