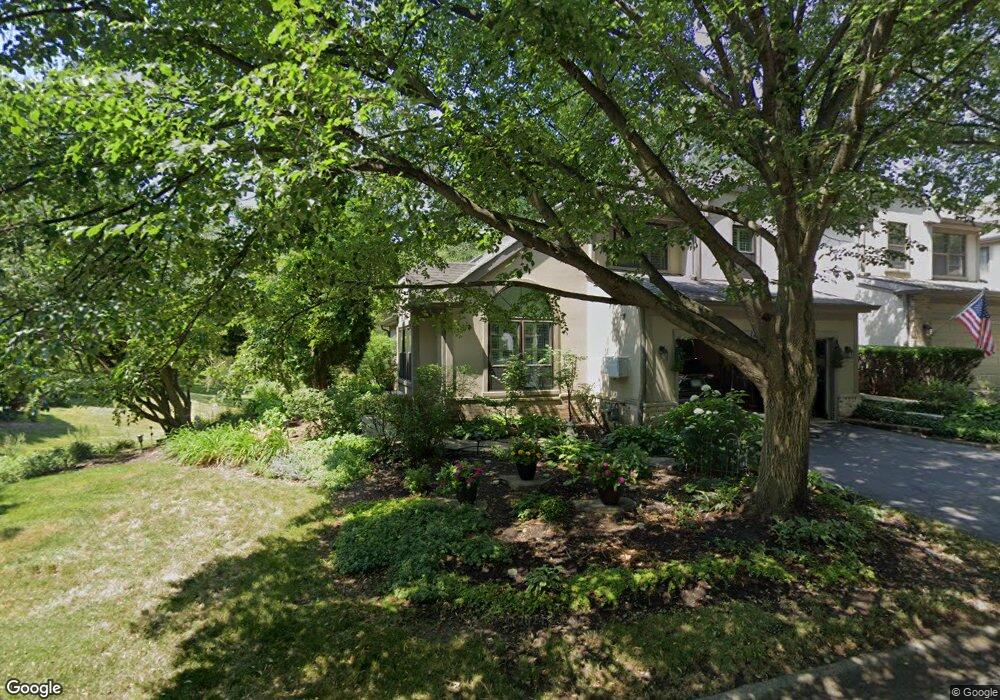
1219 Hobson Oaks Dr Naperville, IL 60540
Meadow Glens NeighborhoodEstimated Value: $512,000 - $553,000
--
Bed
1
Bath
1,911
Sq Ft
$281/Sq Ft
Est. Value
About This Home
This home is located at 1219 Hobson Oaks Dr, Naperville, IL 60540 and is currently estimated at $537,028, approximately $281 per square foot. 1219 Hobson Oaks Dr is a home located in DuPage County with nearby schools including Highlands Elementary School, Kennedy Junior High School, and Naperville North High School.
Ownership History
Date
Name
Owned For
Owner Type
Purchase Details
Closed on
Nov 29, 2004
Sold by
Irby Phyllis C
Bought by
Irby Phyllis C and The Phyllis C Irby Trust
Current Estimated Value
Purchase Details
Closed on
Dec 20, 1999
Sold by
Sanchez Patricia Pulido and Pulido Patricia
Bought by
Irby Phyllis C
Home Financials for this Owner
Home Financials are based on the most recent Mortgage that was taken out on this home.
Original Mortgage
$174,000
Outstanding Balance
$54,059
Interest Rate
7.76%
Estimated Equity
$482,969
Purchase Details
Closed on
Jun 26, 1997
Sold by
Feeney Alice G
Bought by
Pulido Patricia
Home Financials for this Owner
Home Financials are based on the most recent Mortgage that was taken out on this home.
Original Mortgage
$182,650
Interest Rate
7%
Create a Home Valuation Report for This Property
The Home Valuation Report is an in-depth analysis detailing your home's value as well as a comparison with similar homes in the area
Home Values in the Area
Average Home Value in this Area
Purchase History
| Date | Buyer | Sale Price | Title Company |
|---|---|---|---|
| Irby Phyllis C | -- | -- | |
| Irby Phyllis C | $249,000 | Intercounty Title | |
| Pulido Patricia | $243,000 | -- |
Source: Public Records
Mortgage History
| Date | Status | Borrower | Loan Amount |
|---|---|---|---|
| Open | Irby Phyllis C | $174,000 | |
| Previous Owner | Pulido Patricia | $182,650 |
Source: Public Records
Tax History Compared to Growth
Tax History
| Year | Tax Paid | Tax Assessment Tax Assessment Total Assessment is a certain percentage of the fair market value that is determined by local assessors to be the total taxable value of land and additions on the property. | Land | Improvement |
|---|---|---|---|---|
| 2024 | $9,520 | $171,400 | $40,475 | $130,925 |
| 2023 | $9,125 | $156,430 | $36,940 | $119,490 |
| 2022 | $8,768 | $146,480 | $34,590 | $111,890 |
| 2021 | $7,964 | $140,940 | $33,280 | $107,660 |
| 2020 | $7,787 | $138,400 | $32,680 | $105,720 |
| 2019 | $7,544 | $132,420 | $31,270 | $101,150 |
| 2018 | $7,020 | $124,000 | $29,280 | $94,720 |
| 2017 | $6,860 | $113,590 | $28,290 | $85,300 |
| 2016 | $6,708 | $109,490 | $27,270 | $82,220 |
| 2015 | $6,640 | $103,110 | $25,680 | $77,430 |
| 2014 | $6,595 | $94,600 | $23,560 | $71,040 |
| 2013 | $6,496 | $94,830 | $23,620 | $71,210 |
Source: Public Records
Map
Nearby Homes
- 8S452 Bell Dr
- 1449 Whitespire Ct Unit 5104
- 907 Secretariat Dr
- 1006 Bankfield Ct
- 1408 Swallow St
- 1216 Tranquility Ct
- 923 Tim Tam Cir
- 625 Edward Rd
- 1519 77th St
- 158 E Bailey Rd Unit F
- 128 E Bailey Rd Unit G
- 1323 Auburn Ave
- 138 E Bailey Rd Unit M
- 908 Julian Ct
- 1300 Old Dominion Rd
- 621 Bourbon Ct
- 1386 Old Dominion Ct
- 1340 Auburn Ave
- 1643 Estate Cir
- 1751 S Washington St Unit 1
- 1217 Hobson Oaks Dr
- 1215 Hobson Oaks Dr
- 1213 Hobson Oaks Dr
- 1220 Hobson Oaks Ct
- 1231 Hobson Oaks Dr
- 1233 Hobson Oaks Dr
- 1211 Hobson Oaks Dr
- 1235 Hobson Oaks Dr
- 1218 Hobson Oaks Ct
- 1226 Hobson Oaks Dr
- 1216 Hobson Oaks Ct
- 1228 Hobson Oaks Dr
- 1209 Hobson Oaks Dr
- 1230 Hobson Oaks Dr
- 1232 Hobson Oaks Dr
- 1214 Hobson Oaks Ct
- 1207 Hobson Oaks Dr
- 1212 Hobson Oaks Ct
- 1243 Hobson Oaks Dr
- 1234 Hobson Oaks Dr