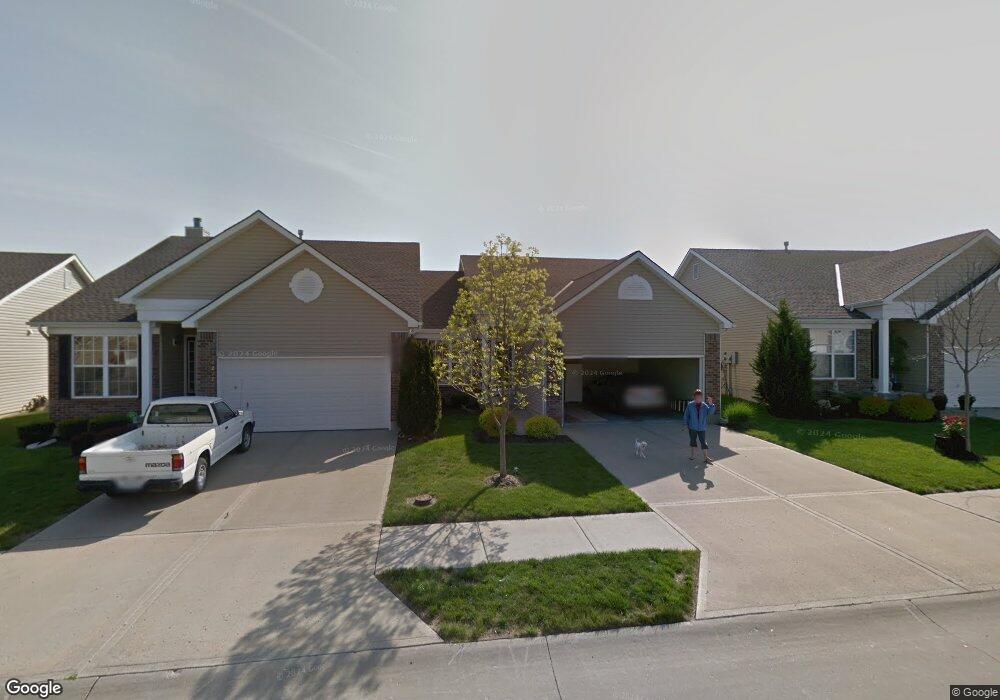
1219 SW Arborfair Dr Lees Summit, MO 64082
Estimated Value: $266,000 - $346,000
2
Beds
2
Baths
1,320
Sq Ft
$233/Sq Ft
Est. Value
About This Home
This home is located at 1219 SW Arborfair Dr, Lees Summit, MO 64082 and is currently estimated at $307,872, approximately $233 per square foot. 1219 SW Arborfair Dr is a home located in Jackson County with nearby schools including Summit Pointe Elementary School, Summit Lakes Middle School, and Lee's Summit West High School.
Ownership History
Date
Name
Owned For
Owner Type
Purchase Details
Closed on
Feb 19, 2020
Sold by
Cherry Rosalie and Cherry Rosalie D
Bought by
Lovelace Kirsten J and Rosalie D Cherry Trust
Current Estimated Value
Purchase Details
Closed on
Jul 30, 2009
Sold by
Bryant Stephen B and Bryant Teresa A
Bought by
Cherry Rosalie
Purchase Details
Closed on
Nov 30, 2006
Sold by
Mcbride & Son Homes Kansas City Llc
Bought by
Bryant Stephen B and Bryant Teresa A
Home Financials for this Owner
Home Financials are based on the most recent Mortgage that was taken out on this home.
Original Mortgage
$110,000
Interest Rate
6.37%
Mortgage Type
Purchase Money Mortgage
Create a Home Valuation Report for This Property
The Home Valuation Report is an in-depth analysis detailing your home's value as well as a comparison with similar homes in the area
Home Values in the Area
Average Home Value in this Area
Purchase History
| Date | Buyer | Sale Price | Title Company |
|---|---|---|---|
| Lovelace Kirsten J | -- | None Available | |
| Cherry Rosalie | -- | Continental Title Co | |
| Bryant Stephen B | -- | Thomson Title Corporation |
Source: Public Records
Mortgage History
| Date | Status | Borrower | Loan Amount |
|---|---|---|---|
| Previous Owner | Bryant Stephen B | $110,000 |
Source: Public Records
Tax History Compared to Growth
Tax History
| Year | Tax Paid | Tax Assessment Tax Assessment Total Assessment is a certain percentage of the fair market value that is determined by local assessors to be the total taxable value of land and additions on the property. | Land | Improvement |
|---|---|---|---|---|
| 2025 | $3,983 | $55,281 | $10,228 | $45,053 |
| 2024 | $3,954 | $55,165 | $4,589 | $50,576 |
| 2023 | $3,954 | $55,164 | $6,361 | $48,803 |
| 2022 | $3,374 | $41,800 | $3,567 | $38,233 |
| 2021 | $3,444 | $41,800 | $3,567 | $38,233 |
| 2020 | $3,044 | $36,588 | $3,567 | $33,021 |
| 2019 | $2,961 | $36,588 | $3,567 | $33,021 |
| 2018 | $2,777 | $31,844 | $3,105 | $28,739 |
| 2017 | $2,735 | $31,844 | $3,105 | $28,739 |
| 2016 | $2,735 | $31,046 | $5,149 | $25,897 |
| 2014 | $2,845 | $31,654 | $4,655 | $26,999 |
Source: Public Records
Map
Nearby Homes
- 1222 SW Arbor Park Dr
- 1100 SW Arborfair Dr
- 1128 SW Arbormill Terrace
- 1912 SW Hightown Dr
- Delano Plan at Pryor Ridge
- Fairfield Expanded Plan at Pryor Ridge
- Glenwood Plan at Pryor Ridge
- Windsor Plan at Pryor Ridge
- Opus II Plan at Pryor Ridge
- Danbury Plan at Pryor Ridge
- Inglenook Plan at Pryor Ridge
- Sonoma Plan at Pryor Ridge
- Calistoga Plan at Pryor Ridge
- Fairfield Plan at Pryor Ridge
- Monterey Plan at Pryor Ridge
- Bristol Plan at Pryor Ridge
- 4001 SW Mondavi Dr
- 4400 Doc Henry Rd
- 1009 SW Arborfair Dr
- 1069 SW Arborway Dr
- 1233 SW Arborfair Dr
- 1217 SW Arborfair Dr
- 1235 SW Arborfair Dr
- 1203 SW Arborfair Dr
- 1228 SW Arbormill Terrace
- 1226 SW Arbormill Terrace
- 1240 SW Arbormill Terrace
- 1216 SW Arbormill Terrace
- 1201 SW Arborfair Dr
- 1242 SW Arbormill Terrace
- 1214 SW Arbormill Terrace
- 1202 SW Arborfair Dr
- 1216 SW Arborfair Dr
- 1200 SW Arborfair Dr
- 1180 SW Arborfair Dr
- 1181 SW Arborfair Dr
- 1218 SW Arborfair Dr
- 1204 SW Arbormill Terrace
- 1178 SW Arborfair Dr
- 1179 SW Arborfair Dr