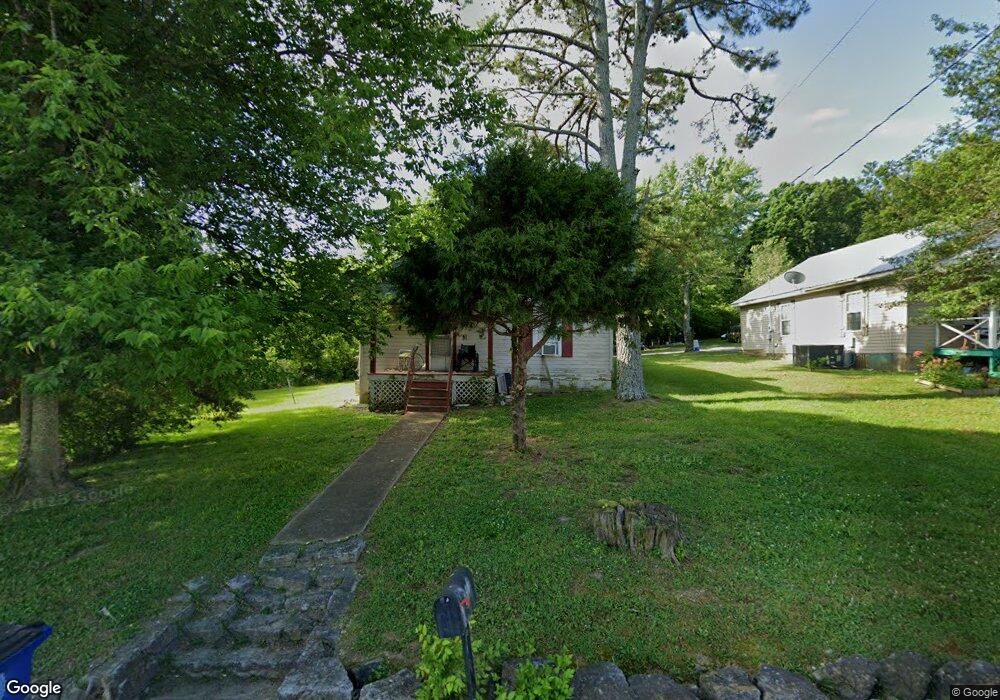
1219 W Jackson St Shelbyville, TN 37160
Estimated Value: $83,000 - $240,000
--
Bed
1
Bath
840
Sq Ft
$176/Sq Ft
Est. Value
About This Home
This home is located at 1219 W Jackson St, Shelbyville, TN 37160 and is currently estimated at $147,973, approximately $176 per square foot. 1219 W Jackson St is a home located in Bedford County with nearby schools including South Side Elementary School, Harris Middle School, and Christian Chapel Academy.
Ownership History
Date
Name
Owned For
Owner Type
Purchase Details
Closed on
Sep 23, 2025
Sold by
Johns Sam
Bought by
Smith Sterling
Current Estimated Value
Purchase Details
Closed on
Dec 30, 2022
Sold by
Byrd Charles Louis
Bought by
Johns Sam
Home Financials for this Owner
Home Financials are based on the most recent Mortgage that was taken out on this home.
Original Mortgage
$100,000
Interest Rate
6.42%
Purchase Details
Closed on
Dec 4, 2017
Sold by
Sanders Janelle
Bought by
Byrd Charles
Purchase Details
Closed on
Jul 31, 2006
Sold by
Young John
Bought by
Hicks James
Purchase Details
Closed on
Jan 20, 2006
Sold by
Segroves Minnie R
Bought by
Sanders Bobby G
Purchase Details
Closed on
Dec 7, 2000
Sold by
Damron Roy
Bought by
Sanders Bobby G and Sanders Janell
Purchase Details
Closed on
Oct 6, 1987
Bought by
Taylor Ted K
Purchase Details
Closed on
Oct 24, 1986
Bought by
Mary Raulerson W and Mary Alice
Purchase Details
Closed on
Jan 1, 1985
Create a Home Valuation Report for This Property
The Home Valuation Report is an in-depth analysis detailing your home's value as well as a comparison with similar homes in the area
Home Values in the Area
Average Home Value in this Area
Purchase History
| Date | Buyer | Sale Price | Title Company |
|---|---|---|---|
| Smith Sterling | $80,000 | Hitchcock Title | |
| Johns Sam | $75,000 | Hitchcock Title | |
| Byrd Charles | $17,000 | Hitchcock Title Company | |
| Hicks James | $50,000 | -- | |
| Sanders Bobby G | -- | -- | |
| Sanders Bobby G | $13,000 | -- | |
| Taylor Ted K | $17,000 | -- | |
| Mary Raulerson W | -- | -- | |
| -- | $20,000 | -- |
Source: Public Records
Mortgage History
| Date | Status | Borrower | Loan Amount |
|---|---|---|---|
| Previous Owner | Johns Sam | $100,000 |
Source: Public Records
Tax History Compared to Growth
Tax History
| Year | Tax Paid | Tax Assessment Tax Assessment Total Assessment is a certain percentage of the fair market value that is determined by local assessors to be the total taxable value of land and additions on the property. | Land | Improvement |
|---|---|---|---|---|
| 2025 | -- | $16,675 | $0 | $0 |
| 2024 | -- | $16,675 | $3,125 | $13,550 |
| 2023 | $635 | $16,675 | $3,125 | $13,550 |
| 2022 | $653 | $16,675 | $3,125 | $13,550 |
| 2021 | $593 | $16,675 | $3,125 | $13,550 |
| 2020 | $388 | $16,675 | $3,125 | $13,550 |
| 2019 | $388 | $8,750 | $2,500 | $6,250 |
| 2018 | $379 | $8,750 | $2,500 | $6,250 |
| 2017 | $379 | $8,750 | $2,500 | $6,250 |
| 2016 | $375 | $8,750 | $2,500 | $6,250 |
| 2015 | $375 | $8,750 | $2,500 | $6,250 |
| 2014 | $312 | $7,950 | $0 | $0 |
Source: Public Records
Map
Nearby Homes
- 201 Shelbyville Mills Rd
- 146 Tanner Cir
- 144 Tanner Cir
- 142 Tanner Cir
- 105 Fairway Green
- 181 Hendon Memorial Rd
- 1204 W Lane St
- 100 Baker St
- 112 N Linda Dr
- 115 W End Cir
- 600 Lewis Ave
- 111 Parker Rd
- 508 Lewis Ave
- 702 Adams Dr
- 108 Demombreum Cir
- 125 Burrum Dr
- 109 Demombreum Cir
- 112 Demombreum Cir
- 418 Riverview Dr
- 101 Briar Patch Dr
- 1221 W Jackson St
- 1223 W Jackson St
- 1225 W Jackson St
- 1220 W Jackson St
- 1227 W Jackson St
- 233 Shelbyville Mills Rd
- 1103 W Jackson St
- 305 Shelbyville Mills Rd
- 1222 W Jackson St
- 229 Shelbyville Mills Rd
- 1218 W Jackson St
- 225 Shelbyville Mills Rd
- 100 Beechwood Ln
- 307 Shelbyville Mills Rd
- 1603 Shelbyville Mills Rd
- 232 Shelbyville Mills Rd
- 234 Shelbyville Mills Rd
- 304 Shelbyville Mills Rd
- 223 Shelbyville Mills Rd
- 302 Shelbyville Mills Rd