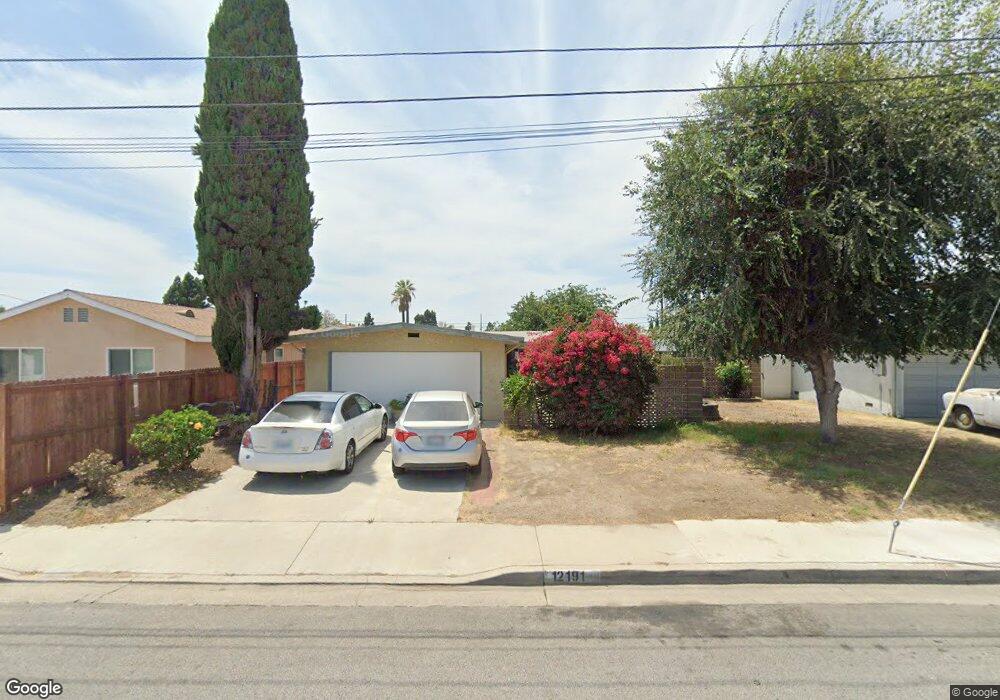
12191 Haga St Garden Grove, CA 92841
Estimated Value: $911,912 - $1,148,000
4
Beds
2
Baths
1,207
Sq Ft
$846/Sq Ft
Est. Value
About This Home
This home is located at 12191 Haga St, Garden Grove, CA 92841 and is currently estimated at $1,021,478, approximately $846 per square foot. 12191 Haga St is a home located in Orange County with nearby schools including Lawrence Elementary School, Alamitos Intermediate School, and Rancho Alamitos High School.
Ownership History
Date
Name
Owned For
Owner Type
Purchase Details
Closed on
Oct 27, 2017
Sold by
Thomblison William
Bought by
Thomblison William and Thomblison Pam
Current Estimated Value
Home Financials for this Owner
Home Financials are based on the most recent Mortgage that was taken out on this home.
Original Mortgage
$846,000
Interest Rate
4.75%
Mortgage Type
Reverse Mortgage Home Equity Conversion Mortgage
Purchase Details
Closed on
Dec 20, 2011
Sold by
Thomblison William and Thomblison Pam
Bought by
Thomblison William
Purchase Details
Closed on
Oct 27, 2011
Sold by
Thomblison William and Thomblison Pam
Bought by
Thomblison William and Thomblison Pam
Purchase Details
Closed on
Feb 13, 2009
Sold by
Fancher Evelyn G
Bought by
Fancher Evelyn G and Thomblison William
Create a Home Valuation Report for This Property
The Home Valuation Report is an in-depth analysis detailing your home's value as well as a comparison with similar homes in the area
Home Values in the Area
Average Home Value in this Area
Purchase History
| Date | Buyer | Sale Price | Title Company |
|---|---|---|---|
| Thomblison William | -- | Placer Title Co | |
| Thomblison William | -- | Placer Title Company | |
| Thomblison William | -- | None Available | |
| Fancher Evelyn G | -- | Accommodation |
Source: Public Records
Mortgage History
| Date | Status | Borrower | Loan Amount |
|---|---|---|---|
| Closed | Thomblison William | $846,000 |
Source: Public Records
Tax History Compared to Growth
Tax History
| Year | Tax Paid | Tax Assessment Tax Assessment Total Assessment is a certain percentage of the fair market value that is determined by local assessors to be the total taxable value of land and additions on the property. | Land | Improvement |
|---|---|---|---|---|
| 2025 | $2,929 | $239,150 | $171,815 | $67,335 |
| 2024 | $2,929 | $234,461 | $168,446 | $66,015 |
| 2023 | $2,871 | $229,864 | $165,143 | $64,721 |
| 2022 | $2,807 | $225,357 | $161,905 | $63,452 |
| 2021 | $2,777 | $220,939 | $158,731 | $62,208 |
| 2020 | $2,740 | $218,674 | $157,103 | $61,571 |
| 2019 | $2,690 | $214,387 | $154,023 | $60,364 |
| 2018 | $3,195 | $210,184 | $151,003 | $59,181 |
| 2017 | $3,148 | $206,063 | $148,042 | $58,021 |
| 2016 | $3,030 | $202,023 | $145,139 | $56,884 |
| 2015 | $2,992 | $198,989 | $142,959 | $56,030 |
| 2014 | $2,927 | $195,092 | $140,159 | $54,933 |
Source: Public Records
Map
Nearby Homes
- 12101 Dale Ave Unit 69
- 12101 Dale Ave Unit 44
- 8895 Sequoia Ct
- 11841 Magnolia St
- 12562 Dale St Unit 47
- 8185 Del Rey Dr
- 9022 Marlene Ave
- 11791 Nearing Dr
- 12315 Westcliff Dr
- 11912 Arthur Dr
- 9052 Marie Ln
- 28 Bigsby Dr
- 47 Bigsby Dr
- 11691 Faun Ln
- 43 Bigsby Dr
- 8732 Orangewood Ave
- 9041 Shelley Dr
- 12071 Marlowe Dr
- 8102 La Monte Rd
- 8111 Stanford Ave