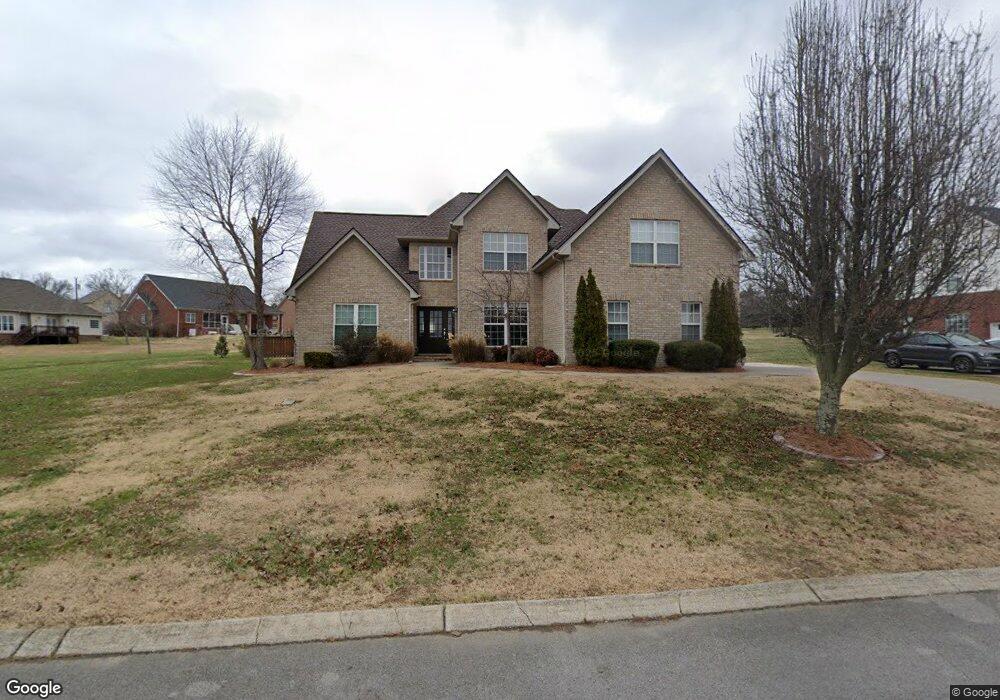
122 Beagle Run Mount Juliet, TN 37122
Estimated Value: $595,000 - $637,000
4
Beds
3
Baths
2,898
Sq Ft
$212/Sq Ft
Est. Value
About This Home
This home is located at 122 Beagle Run, Mount Juliet, TN 37122 and is currently estimated at $615,107, approximately $212 per square foot. 122 Beagle Run is a home located in Wilson County with nearby schools including Gladeville Elementary School, Gladeville Middle School, and Wilson Central High School.
Ownership History
Date
Name
Owned For
Owner Type
Purchase Details
Closed on
May 18, 2015
Sold by
Myers Gary P
Bought by
Curtis Zackery H and Curtis Amanda C
Current Estimated Value
Home Financials for this Owner
Home Financials are based on the most recent Mortgage that was taken out on this home.
Original Mortgage
$224,000
Outstanding Balance
$173,248
Interest Rate
3.79%
Mortgage Type
New Conventional
Estimated Equity
$441,859
Purchase Details
Closed on
Aug 1, 2006
Sold by
Landmark Homes Of Tennesse
Bought by
Myers Gary P
Home Financials for this Owner
Home Financials are based on the most recent Mortgage that was taken out on this home.
Original Mortgage
$270,846
Interest Rate
6.74%
Mortgage Type
VA
Purchase Details
Closed on
Jan 17, 2006
Sold by
Larry Powell Builders Inc
Bought by
Landmark Homes Of Tennessee In
Create a Home Valuation Report for This Property
The Home Valuation Report is an in-depth analysis detailing your home's value as well as a comparison with similar homes in the area
Home Values in the Area
Average Home Value in this Area
Purchase History
| Date | Buyer | Sale Price | Title Company |
|---|---|---|---|
| Curtis Zackery H | $280,000 | -- | |
| Myers Gary P | $262,194 | -- | |
| Landmark Homes Of Tennessee In | $122,500 | -- |
Source: Public Records
Mortgage History
| Date | Status | Borrower | Loan Amount |
|---|---|---|---|
| Open | Curtis Zackery H | $224,000 | |
| Previous Owner | Landmark Homes Of Tennessee In | $270,846 |
Source: Public Records
Tax History Compared to Growth
Tax History
| Year | Tax Paid | Tax Assessment Tax Assessment Total Assessment is a certain percentage of the fair market value that is determined by local assessors to be the total taxable value of land and additions on the property. | Land | Improvement |
|---|---|---|---|---|
| 2024 | $1,918 | $100,475 | $25,000 | $75,475 |
| 2022 | $1,918 | $100,475 | $25,000 | $75,475 |
| 2021 | $1,918 | $100,475 | $25,000 | $75,475 |
| 2020 | $2,052 | $100,475 | $25,000 | $75,475 |
| 2019 | $1,799 | $71,425 | $15,000 | $56,425 |
| 2018 | $1,793 | $71,175 | $15,000 | $56,175 |
| 2017 | $1,793 | $71,175 | $15,000 | $56,175 |
| 2016 | $1,793 | $71,175 | $15,000 | $56,175 |
| 2015 | $1,829 | $71,175 | $15,000 | $56,175 |
| 2014 | $1,557 | $60,574 | $0 | $0 |
Source: Public Records
Map
Nearby Homes
- 823 Tall Oak Trail
- 685 Castle Rd
- 1525 Harkreader Rd
- 511 Oakvale Ln
- 5731 Stewarts Ferry Pike
- 1964 Harkreader Rd
- 2115 Harkreader Rd
- 561 Oakvale Ln
- 574 Oakvale Ln
- 447 Sanders Ln
- 4014 Asbury Place
- 591 Oakvale Ln
- 7736 Stewarts Ferry Pike
- 0 Lohman Rd
- 5281 Stewarts Ferry Pike
- 411 Boulder Creek Ct
- 237 Quad Oak Dr
- 800 Evan Ct
- 603 Sophia Ct
- 0 Central Pike Unit RTC3011631
- 120 Beagle Run
- 118 Beagle Run
- 242 Rockytop Trail
- 240 Rockytop Trail
- 121 Beagle Run
- 119 Beagle Run
- 116 Beagle Run
- 123 Beagle Run
- 238 Rockytop Trail
- 132 Beagle Run
- 117 Beagle Run
- 236 Rockytop Trail
- 114 Beagle Run
- 115 Beagle Run
- 245 Rockytop Trail
- 234 Rockytop Trail
- 34 Morriswood Dr Lot 34
- 113 Beagle Run
- 134 Beagle Run
- 112 Beagle Run