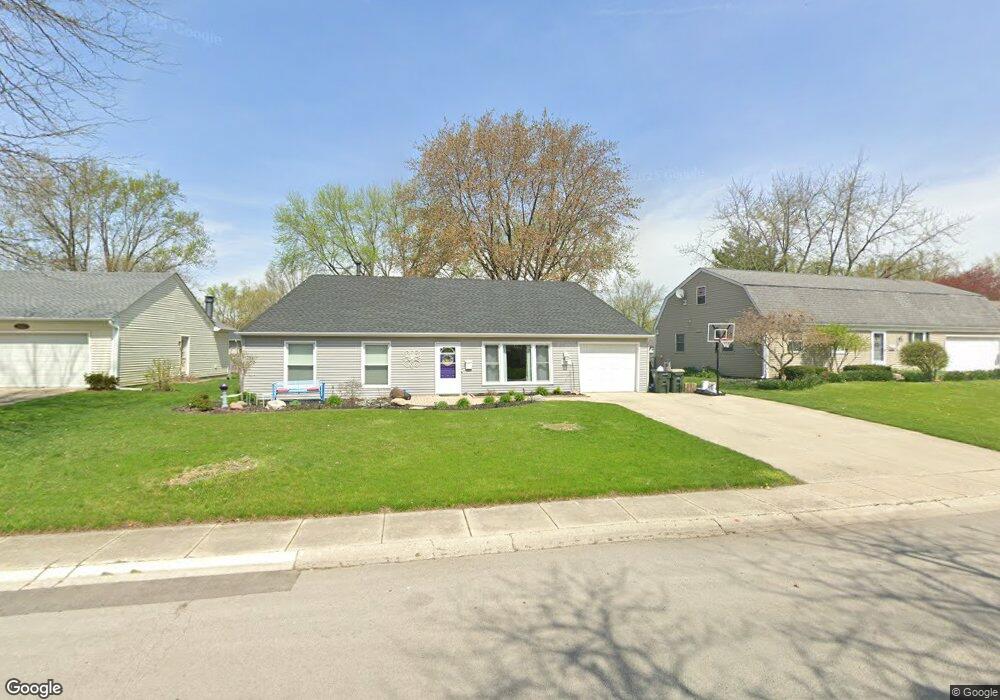
122 Circle Dr W Montgomery, IL 60538
Boulder Hill NeighborhoodEstimated Value: $316,851 - $342,000
3
Beds
2
Baths
1,722
Sq Ft
$192/Sq Ft
Est. Value
About This Home
This home is located at 122 Circle Dr W, Montgomery, IL 60538 and is currently estimated at $331,213, approximately $192 per square foot. 122 Circle Dr W is a home located in Kendall County with nearby schools including Boulder Hill Elementary School, Thompson Jr. High School, and Oswego High School.
Ownership History
Date
Name
Owned For
Owner Type
Purchase Details
Closed on
Jan 19, 2019
Sold by
Tazelaar Louis C and Chapman Danial P
Bought by
Tazelaar Tammy L
Current Estimated Value
Home Financials for this Owner
Home Financials are based on the most recent Mortgage that was taken out on this home.
Original Mortgage
$164,326
Interest Rate
4.99%
Mortgage Type
FHA
Purchase Details
Closed on
May 17, 2010
Sold by
Zidlicky John J
Bought by
Tazelaar Louis C and Chapman Danial P
Home Financials for this Owner
Home Financials are based on the most recent Mortgage that was taken out on this home.
Original Mortgage
$152,841
Interest Rate
5.37%
Mortgage Type
FHA
Purchase Details
Closed on
Oct 30, 1996
Sold by
Woolsey Holly F
Bought by
Zidlicky John J
Purchase Details
Closed on
Dec 1, 1993
Bought by
Zidlicky John and Zidlicky Woolsey, H
Create a Home Valuation Report for This Property
The Home Valuation Report is an in-depth analysis detailing your home's value as well as a comparison with similar homes in the area
Home Values in the Area
Average Home Value in this Area
Purchase History
| Date | Buyer | Sale Price | Title Company |
|---|---|---|---|
| Tazelaar Tammy L | $23,500 | Title Source Inc | |
| Tazelaar Louis C | $155,000 | Ticor Title | |
| Zidlicky John J | -- | -- | |
| Zidlicky John | $88,000 | -- |
Source: Public Records
Mortgage History
| Date | Status | Borrower | Loan Amount |
|---|---|---|---|
| Previous Owner | Tazelaar Tammy L | $164,326 | |
| Previous Owner | Tazelaar Louis C | $152,841 | |
| Closed | Zidlicky John | -- |
Source: Public Records
Tax History Compared to Growth
Tax History
| Year | Tax Paid | Tax Assessment Tax Assessment Total Assessment is a certain percentage of the fair market value that is determined by local assessors to be the total taxable value of land and additions on the property. | Land | Improvement |
|---|---|---|---|---|
| 2024 | $6,574 | $89,053 | $23,599 | $65,454 |
| 2023 | $6,010 | $78,808 | $20,884 | $57,924 |
| 2022 | $6,010 | $73,653 | $19,518 | $54,135 |
| 2021 | $5,785 | $68,834 | $18,241 | $50,593 |
| 2020 | $5,596 | $66,186 | $17,539 | $48,647 |
| 2019 | $5,686 | $66,186 | $17,539 | $48,647 |
| 2018 | $5,184 | $60,394 | $16,004 | $44,390 |
| 2017 | $5,015 | $55,662 | $14,750 | $40,912 |
| 2016 | $4,618 | $51,066 | $13,532 | $37,534 |
| 2015 | $4,439 | $47,284 | $12,530 | $34,754 |
| 2014 | -- | $45,465 | $12,048 | $33,417 |
| 2013 | -- | $47,858 | $12,682 | $35,176 |
Source: Public Records
Map
Nearby Homes
- 4 Circle Ct
- 22 Sherwick Rd
- 47 Old Post Rd
- 10 Crofton Rd
- 9 Cebold Dr
- 40 Codorus Rd
- 38 Ashlawn Ave
- 39 Cayman Dr
- 43 Hampton Rd
- 3 Scarsdale Rd
- 3 Orchard Rd
- 123 Orchard Rd
- 2 Orchard Rd
- 420 Chesterfield Ct Unit 420
- 28 Seneca Dr
- 119 Garden Dr
- 117 Boulder Hill Pass Unit 117
- 30 Hampton Rd
- 19 Wyndham Dr Unit 10
- 1415 State Route 31
- 124 Circle Dr W
- 120 Circle Dr W
- 18 Pickford Rd
- 126 Circle Dr W
- 123 Circle Dr W
- 22 Pickford Rd
- 121 Circle Dr W
- 125 Circle Dr W
- 128 Circle Dr W
- 116 Circle Dr W
- 14 Pickford Rd
- 2 Yeadon Dr
- 127 Circle Dr W Unit 21
- 24 Pickford Rd Unit 21
- 130 Circle Dr W
- 114 Circle Dr W
- 129 Circle Dr W
- 19 Pickford Rd
- 17 Pickford Rd
- 21 Pickford Rd