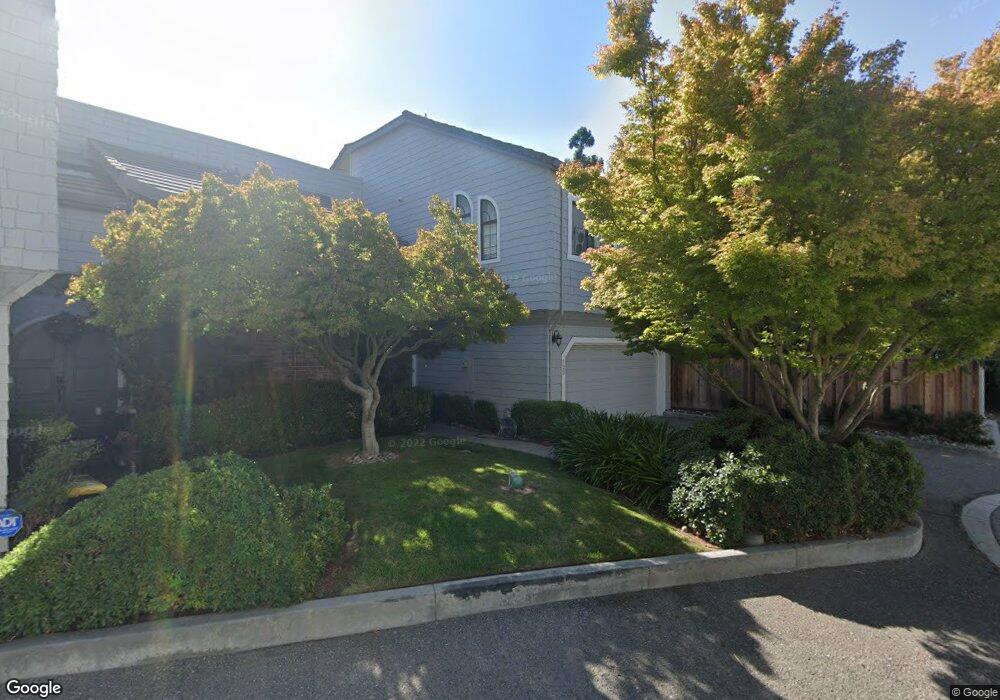
122 Redding Rd Campbell, CA 95008
Estimated Value: $1,205,000 - $1,318,863
3
Beds
3
Baths
1,790
Sq Ft
$711/Sq Ft
Est. Value
About This Home
This home is located at 122 Redding Rd, Campbell, CA 95008 and is currently estimated at $1,273,466, approximately $711 per square foot. 122 Redding Rd is a home located in Santa Clara County with nearby schools including Leigh High School, Branham High School, and Farnham Elementary School.
Ownership History
Date
Name
Owned For
Owner Type
Purchase Details
Closed on
Jan 29, 2016
Sold by
Greenfield Howard M
Bought by
Greenfield Howard M
Current Estimated Value
Home Financials for this Owner
Home Financials are based on the most recent Mortgage that was taken out on this home.
Original Mortgage
$455,000
Outstanding Balance
$359,346
Interest Rate
3.83%
Mortgage Type
New Conventional
Estimated Equity
$914,120
Purchase Details
Closed on
Dec 8, 2015
Sold by
Greenfield Howard M
Bought by
Greenfield Howard M
Home Financials for this Owner
Home Financials are based on the most recent Mortgage that was taken out on this home.
Original Mortgage
$455,000
Outstanding Balance
$359,346
Interest Rate
3.83%
Mortgage Type
New Conventional
Estimated Equity
$914,120
Purchase Details
Closed on
Oct 30, 2015
Sold by
Greenfield Elizabeth L
Bought by
Greenfield Howard M
Home Financials for this Owner
Home Financials are based on the most recent Mortgage that was taken out on this home.
Original Mortgage
$455,000
Outstanding Balance
$359,346
Interest Rate
3.83%
Mortgage Type
New Conventional
Estimated Equity
$914,120
Purchase Details
Closed on
Feb 2, 2010
Sold by
Spivey Shannon and Spivey Andrew
Bought by
Greenfield Howard M and Greenfield Elizabeth L
Home Financials for this Owner
Home Financials are based on the most recent Mortgage that was taken out on this home.
Original Mortgage
$494,062
Interest Rate
5.11%
Mortgage Type
New Conventional
Purchase Details
Closed on
Oct 18, 2007
Sold by
Craig Diane and Craig Scott
Bought by
Spivey Shannon and Spivey Andrew
Home Financials for this Owner
Home Financials are based on the most recent Mortgage that was taken out on this home.
Original Mortgage
$568,000
Interest Rate
6.42%
Mortgage Type
Negative Amortization
Purchase Details
Closed on
May 15, 2005
Sold by
Karamian Narbik and Karamian Raya S
Bought by
Craig Scott and Craig Diane
Home Financials for this Owner
Home Financials are based on the most recent Mortgage that was taken out on this home.
Original Mortgage
$97,500
Interest Rate
5.84%
Mortgage Type
Credit Line Revolving
Purchase Details
Closed on
Oct 28, 1999
Sold by
Morrison Stanley M and Morrison Jessica M
Bought by
Karamian Narbik and Karamian Raya S
Home Financials for this Owner
Home Financials are based on the most recent Mortgage that was taken out on this home.
Original Mortgage
$319,200
Interest Rate
7.68%
Create a Home Valuation Report for This Property
The Home Valuation Report is an in-depth analysis detailing your home's value as well as a comparison with similar homes in the area
Home Values in the Area
Average Home Value in this Area
Purchase History
| Date | Buyer | Sale Price | Title Company |
|---|---|---|---|
| Greenfield Howard M | -- | None Available | |
| Greenfield Howard M | -- | Orange Coast Title Company | |
| Greenfield Howard M | -- | None Available | |
| Greenfield Howard M | $581,500 | Chicago Title Company | |
| Spivey Shannon | $710,000 | Financial Title Company | |
| Craig Scott | $650,000 | North American Title Company | |
| Karamian Narbik | $399,000 | Chicago Title Co |
Source: Public Records
Mortgage History
| Date | Status | Borrower | Loan Amount |
|---|---|---|---|
| Open | Greenfield Howard M | $455,000 | |
| Closed | Greenfield Howard M | $494,062 | |
| Previous Owner | Spivey Shannon | $568,000 | |
| Previous Owner | Craig Scott | $97,500 | |
| Previous Owner | Craig Scott | $520,000 | |
| Previous Owner | Karamian Narbik | $319,200 | |
| Closed | Karamian Narbik | $59,850 |
Source: Public Records
Tax History
| Year | Tax Paid | Tax Assessment Tax Assessment Total Assessment is a certain percentage of the fair market value that is determined by local assessors to be the total taxable value of land and additions on the property. | Land | Improvement |
|---|---|---|---|---|
| 2025 | $9,966 | $750,277 | $375,106 | $375,171 |
| 2024 | $9,966 | $735,566 | $367,751 | $367,815 |
| 2023 | $9,949 | $721,144 | $360,541 | $360,603 |
| 2022 | $9,793 | $707,005 | $353,472 | $353,533 |
| 2021 | $9,603 | $693,143 | $346,542 | $346,601 |
| 2020 | $9,158 | $686,037 | $342,989 | $343,048 |
| 2019 | $9,024 | $672,586 | $336,264 | $336,322 |
| 2018 | $8,742 | $659,399 | $329,671 | $329,728 |
| 2017 | $8,540 | $646,470 | $323,207 | $323,263 |
| 2016 | $8,100 | $633,795 | $316,870 | $316,925 |
| 2015 | $7,969 | $624,276 | $312,111 | $312,165 |
| 2014 | $7,757 | $612,049 | $305,998 | $306,051 |
Source: Public Records
Map
Nearby Homes
- 135 Redding Rd Unit A
- 1054 Longfellow Ave
- 3673 S Bascom Ave
- 3523 Mccoppin Park Ct
- 3492 Wine Barrel Way
- 116 Monte Villa Ct
- 1500 Camden Ave
- 3449 Wine Cask Way
- 1155 Shamrock Dr
- 404 Shamrock Dr
- 1172 Longfellow Ave
- 1061 Shamrock Dr
- 3685 Calvin Ave
- 2289 Sun Glory Ln Unit A
- 2178 Casa Mia Dr
- 16137 Loretta Ln
- 219 Beethoven Ln
- 16152 Loretta Ln
- 2163 Woodard Rd
- 2265 Sun Glory Ln Unit A
Your Personal Tour Guide
Ask me questions while you tour the home.