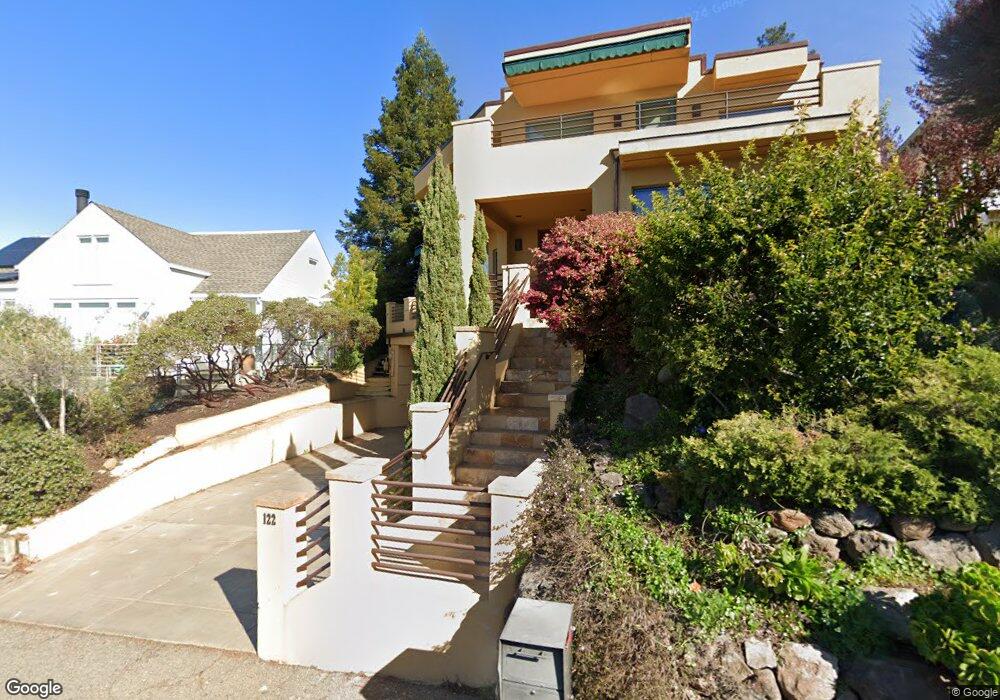
122 Strathmoor Dr Berkeley, CA 94705
Claremont Hills NeighborhoodEstimated Value: $1,879,000 - $2,293,000
6
Beds
3
Baths
3,578
Sq Ft
$596/Sq Ft
Est. Value
About This Home
This home is located at 122 Strathmoor Dr, Berkeley, CA 94705 and is currently estimated at $2,133,736, approximately $596 per square foot. 122 Strathmoor Dr is a home located in Alameda County with nearby schools including Chabot Elementary School, Thornhill Elementary School, and Claremont Middle School.
Ownership History
Date
Name
Owned For
Owner Type
Purchase Details
Closed on
Mar 4, 2014
Sold by
Gero Eva J
Bought by
Gero Eva J and Eva Gero Revocable Trust
Current Estimated Value
Purchase Details
Closed on
Nov 30, 2013
Sold by
Cillag John R
Bought by
Gero Eva J
Purchase Details
Closed on
Dec 17, 1999
Sold by
Lee Betsy P
Bought by
Cillag John R and Gero Eva J
Purchase Details
Closed on
Aug 19, 1998
Sold by
Triunity Ltd Partnership
Bought by
Lee Betsy Pik Chi
Home Financials for this Owner
Home Financials are based on the most recent Mortgage that was taken out on this home.
Original Mortgage
$565,000
Interest Rate
6.88%
Purchase Details
Closed on
May 21, 1998
Sold by
Schiller Gail E and Schiller Eugene
Bought by
Triunity Ltd Partnership
Create a Home Valuation Report for This Property
The Home Valuation Report is an in-depth analysis detailing your home's value as well as a comparison with similar homes in the area
Home Values in the Area
Average Home Value in this Area
Purchase History
| Date | Buyer | Sale Price | Title Company |
|---|---|---|---|
| Gero Eva J | -- | None Available | |
| Gero Eva J | -- | None Available | |
| Cillag John R | $1,175,000 | Old Republic Title Company | |
| Lee Betsy Pik Chi | $102,000 | Old Republic Title Company | |
| Triunity Ltd Partnership | $229,500 | Chicago Title Co |
Source: Public Records
Mortgage History
| Date | Status | Borrower | Loan Amount |
|---|---|---|---|
| Previous Owner | Lee Betsy Pik Chi | $565,000 |
Source: Public Records
Tax History
| Year | Tax Paid | Tax Assessment Tax Assessment Total Assessment is a certain percentage of the fair market value that is determined by local assessors to be the total taxable value of land and additions on the property. | Land | Improvement |
|---|---|---|---|---|
| 2025 | $25,245 | $1,886,128 | $541,753 | $1,344,375 |
| 2024 | $25,245 | $1,849,151 | $531,132 | $1,318,019 |
| 2023 | $26,759 | $1,812,900 | $520,720 | $1,292,180 |
| 2022 | $26,326 | $1,777,358 | $510,511 | $1,266,847 |
| 2021 | $25,442 | $1,742,518 | $500,504 | $1,242,014 |
| 2020 | $25,175 | $1,724,661 | $495,375 | $1,229,286 |
| 2019 | $24,464 | $1,690,850 | $485,663 | $1,205,187 |
| 2018 | $23,968 | $1,657,703 | $476,142 | $1,181,561 |
| 2017 | $23,139 | $1,625,205 | $466,808 | $1,158,397 |
| 2016 | $22,607 | $1,593,346 | $457,657 | $1,135,689 |
| 2015 | $22,504 | $1,569,416 | $450,784 | $1,118,632 |
| 2014 | $22,599 | $1,505,926 | $441,953 | $1,063,973 |
Source: Public Records
Map
Nearby Homes
- 7084 Westmoorland Dr
- 7041 Devon Way
- 7003 Buckingham Blvd
- 0 Buckingham Blvd Unit 41115384
- 6971 Bristol Dr
- 0 Dartmouth Dr
- 0 Gypsy Ln
- 1215 Alvarado Rd
- 1102 Grand View Dr
- 1383 Alvarado Rd
- 1375 Alvarado Rd
- 280 Caldecott Ln Unit 221
- 6716 Charing Cross Rd
- 6839 Sherwick Dr
- 29 Live Oak Rd
- 1881 Grand View Dr
- 1426 Grand View Dr
- 7723 Claremont Ave
- 180 Caldecott Ln Unit 314
- 320 Caldecott Ln Unit 127
- 134 Strathmoor Dr
- 114 Strathmoor Dr
- 142 Strathmoor Dr
- 108 Strathmoor Dr
- 119 Strathmoor Dr
- 7121 Norfolk Rd
- 109 Strathmoor Dr
- 7155 Norfolk Rd
- 7149 Norfolk Rd
- 141 Strathmoor Dr
- 7133 Norfolk Rd
- 7161 Norfolk Rd
- 100 Strathmoor Dr
- 149 Strathmoor Dr
- 85 Strathmoor Dr
- 7171 Norfolk Rd
- 7111 Norfolk Rd
- 84 Strathmoor Dr
- 7091 Kenilworth Rd
- 7068 Kenilworth Rd
Your Personal Tour Guide
Ask me questions while you tour the home.