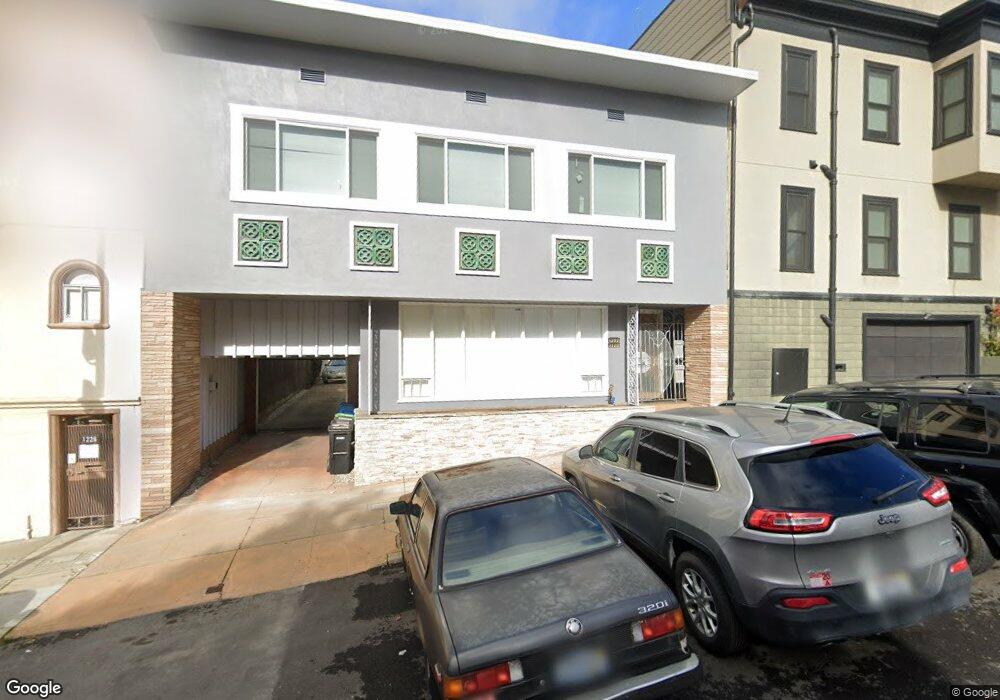
1220 Broadway Unit 1222 San Francisco, CA 94109
Russian Hill NeighborhoodEstimated Value: $1,934,000 - $3,513,250
6
Beds
3
Baths
3,988
Sq Ft
$690/Sq Ft
Est. Value
About This Home
This home is located at 1220 Broadway Unit 1222, San Francisco, CA 94109 and is currently estimated at $2,752,563, approximately $690 per square foot. 1220 Broadway Unit 1222 is a home located in San Francisco County with nearby schools including Yick Wo Elementary School, Francisco Middle School, and Cathedral School for Boys.
Ownership History
Date
Name
Owned For
Owner Type
Purchase Details
Closed on
Aug 17, 2019
Sold by
Wong Jason and Wong Ella
Bought by
Wong Jason Samuel
Current Estimated Value
Purchase Details
Closed on
May 16, 2016
Sold by
Wong Jason and Wong Jason S
Bought by
Wong Family Trust
Purchase Details
Closed on
May 7, 2014
Sold by
Wong Tiger E and Wong Jean Sarah
Bought by
Wong Jason S
Purchase Details
Closed on
Jul 18, 2012
Sold by
Wong Tiger
Bought by
Wong Tiger E and Wong Jean Sarah
Purchase Details
Closed on
Jun 23, 2012
Sold by
Wong Tiger and Moy Pearl
Bought by
Wong Tiger
Purchase Details
Closed on
May 17, 2012
Sold by
Wong Tiger and Moy Pearl
Bought by
Wong Tiger and Moy Pearl
Purchase Details
Closed on
Dec 28, 2004
Sold by
Wong Tiger E and Wong Jean Sarah
Bought by
Wong Tiger E and Wong Sarah Jean
Create a Home Valuation Report for This Property
The Home Valuation Report is an in-depth analysis detailing your home's value as well as a comparison with similar homes in the area
Home Values in the Area
Average Home Value in this Area
Purchase History
| Date | Buyer | Sale Price | Title Company |
|---|---|---|---|
| Wong Jason Samuel | -- | None Available | |
| Wong Family Trust | -- | None Available | |
| Wong Jason S | -- | Old Republic Title Company | |
| Wong Tiger E | -- | None Available | |
| Wong Tiger | -- | None Available | |
| Wong Tiger | -- | None Available | |
| Wong Tiger E | -- | -- |
Source: Public Records
Tax History Compared to Growth
Tax History
| Year | Tax Paid | Tax Assessment Tax Assessment Total Assessment is a certain percentage of the fair market value that is determined by local assessors to be the total taxable value of land and additions on the property. | Land | Improvement |
|---|---|---|---|---|
| 2025 | $31,762 | $2,696,892 | $1,887,825 | $809,067 |
| 2024 | $31,762 | $2,644,012 | $1,850,809 | $793,203 |
| 2023 | $31,294 | $2,592,169 | $1,814,519 | $777,650 |
| 2022 | $30,714 | $2,541,343 | $1,778,941 | $762,402 |
| 2021 | $30,175 | $2,491,513 | $1,744,060 | $747,453 |
| 2020 | $30,344 | $2,465,966 | $1,726,177 | $739,789 |
| 2019 | $2,974 | $186,761 | $74,741 | $112,020 |
| 2018 | $2,873 | $183,100 | $73,276 | $109,824 |
| 2017 | $2,541 | $179,511 | $71,840 | $107,671 |
| 2016 | $2,467 | $175,992 | $70,432 | $105,560 |
| 2015 | $2,432 | $173,350 | $69,375 | $103,975 |
| 2014 | $2,370 | $169,934 | $68,004 | $101,930 |
Source: Public Records
Map
Nearby Homes
- 1250 Vallejo St Unit 7
- 1250 Vallejo St Unit 9
- 1176 Broadway
- 1135 Green St
- 1145 Green St Unit 3
- 1101 Green St Unit 1801
- 1725 Hyde St Unit 1
- 44 Lynch St
- 164 Bernard St
- 1725 Jones St Unit 3
- 74 Lynch St
- 68 Lynch St
- 1070 Green St Unit 801
- 1925 Leavenworth St Unit 7
- 16 Delgado Place
- 1601 Hyde St
- 999 Green St Unit 1501
- 999 Green St Unit 2001
- 1100 Union St Unit 1100
- 1100 Union St Unit 1000
- 1226 Broadway
- 1727 Leavenworth St Unit 1729
- 1727-1729 Leavenworth St
- 1701 Leavenworth St
- 1240 Broadway Unit 1244
- 1246 Broadway Unit 1248
- 1737 Leavenworth St Unit 1739
- 1745 Leavenworth St
- 1252 Broadway
- 1751 Leavenworth St
- 1235 Vallejo St Unit 1239
- 1229 Vallejo St Unit 1233
- 1217 Vallejo St
- 1221 Vallejo St
- 87 Glover St
- 1761 Leavenworth St
- 1732 Leavenworth St
- 1730 Leavenworth St
- 1196 Broadway Unit . 10
- 1196 Broadway