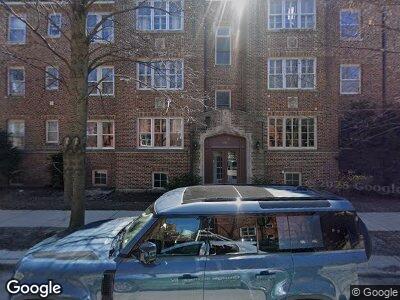
1220 Central St Unit 12202W Evanston, IL 60201
Central Street NeighborhoodEstimated Value: $177,000 - $262,000
1
Bed
--
Bath
840
Sq Ft
$262/Sq Ft
Est. Value
About This Home
This home is located at 1220 Central St Unit 12202W, Evanston, IL 60201 and is currently estimated at $219,780, approximately $261 per square foot. 1220 Central St Unit 12202W is a home located in Cook County with nearby schools including Orrington Elementary School, Haven Middle School, and Evanston Township High School.
Ownership History
Date
Name
Owned For
Owner Type
Purchase Details
Closed on
Sep 30, 2019
Sold by
Cox Craig T and Cox Marcia W
Bought by
Griffith Kenneth B
Current Estimated Value
Home Financials for this Owner
Home Financials are based on the most recent Mortgage that was taken out on this home.
Original Mortgage
$130,500
Outstanding Balance
$117,317
Interest Rate
3.87%
Mortgage Type
New Conventional
Estimated Equity
$65,375
Purchase Details
Closed on
Jan 9, 2017
Sold by
Loellbach Marcia
Bought by
Cox Craig T and Cox Marcia W
Home Financials for this Owner
Home Financials are based on the most recent Mortgage that was taken out on this home.
Original Mortgage
$90,000
Interest Rate
4.09%
Purchase Details
Closed on
Oct 7, 2004
Sold by
Loellbach Marcia
Bought by
Loellbach Marcia and Marcia Loellbach Declaration Of Trust
Create a Home Valuation Report for This Property
The Home Valuation Report is an in-depth analysis detailing your home's value as well as a comparison with similar homes in the area
Home Values in the Area
Average Home Value in this Area
Purchase History
| Date | Buyer | Sale Price | Title Company |
|---|---|---|---|
| Griffith Kenneth B | $135,000 | Fidelity National Title | |
| Loellbach Marcia | -- | -- |
Source: Public Records
Mortgage History
| Date | Status | Borrower | Loan Amount |
|---|---|---|---|
| Open | Griffith Kenneth B | $130,500 | |
| Previous Owner | Cox Marcia | $90,000 | |
| Previous Owner | Loellbach Marcia | $60,000 | |
| Previous Owner | Loellbach Marcia | $61,800 |
Source: Public Records
Tax History Compared to Growth
Tax History
| Year | Tax Paid | Tax Assessment Tax Assessment Total Assessment is a certain percentage of the fair market value that is determined by local assessors to be the total taxable value of land and additions on the property. | Land | Improvement |
|---|---|---|---|---|
| 2024 | $2,377 | $13,655 | $1,432 | $12,223 |
| 2023 | $2,377 | $13,655 | $1,432 | $12,223 |
| 2022 | $2,377 | $13,655 | $1,432 | $12,223 |
| 2021 | $2,295 | $11,977 | $954 | $11,023 |
| 2020 | $3,136 | $11,977 | $954 | $11,023 |
| 2019 | $3,099 | $13,227 | $954 | $12,273 |
| 2018 | $3,121 | $11,391 | $795 | $10,596 |
| 2017 | $3,039 | $11,391 | $795 | $10,596 |
| 2016 | $1,763 | $11,391 | $795 | $10,596 |
| 2015 | $1,811 | $11,250 | $668 | $10,582 |
| 2014 | $1,818 | $11,250 | $668 | $10,582 |
| 2013 | $1,904 | $11,845 | $668 | $11,177 |
Source: Public Records
Map
Nearby Homes
- 1214 Central St Unit 2N
- 1210 Central St Unit 2
- 1319 Lincoln St
- 1404 Lincoln St
- 2245 Wesley Ave
- 810 Lincoln St
- 736 Central St
- 824 Ingleside Place
- 721 Central St
- 250 3rd St
- 728 Lincoln St
- 1105 Leonard Place
- 2256 Sherman Ave Unit 1
- 708 Lincoln St
- 1821 Lincoln St
- 2017 Jackson Ave
- 2233 Sherman Ave
- 2459 Prairie Ave Unit 2F
- 2457 Prairie Ave Unit 3C
- 2457 Prairie Ave Unit 1C
- 1220 Central St Unit 12203W
- 1220 Central St Unit 12202E
- 1220 Central St Unit 12201E
- 1220 Central St Unit 12201W
- 1220 Central St Unit 12202W
- 1220 Central St Unit 12203E
- 1220 Central St Unit 2W
- 1220 Central St Unit 2E
- 1220 Central St Unit 1W
- 1218 Central St Unit 12183N
- 1218 Central St Unit 12183S
- 1218 Central St Unit 12181S
- 1218 Central St Unit 12182S
- 1218 Central St Unit 12181N
- 1218 Central St Unit 3N
- 1222 Central St Unit 2W
- 1222 Central St Unit 12223E
- 1222 Central St Unit 12223W
- 1222 Central St Unit 12222E
- 1222 Central St Unit 12222W