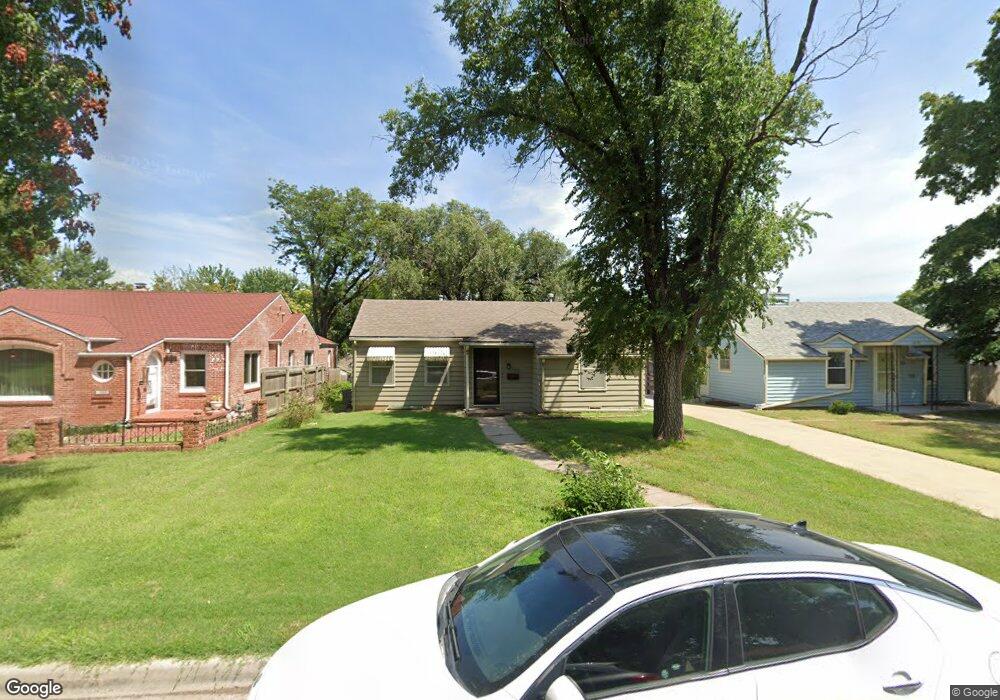
1220 Euclid St Augusta, KS 67010
Estimated Value: $81,000 - $151,000
2
Beds
1
Bath
854
Sq Ft
$130/Sq Ft
Est. Value
About This Home
This home is located at 1220 Euclid St, Augusta, KS 67010 and is currently estimated at $110,869, approximately $129 per square foot. 1220 Euclid St is a home located in Butler County with nearby schools including Augusta Senior High School and St. James Catholic School.
Ownership History
Date
Name
Owned For
Owner Type
Purchase Details
Closed on
Jan 27, 2012
Sold by
Cook James A
Bought by
Stueven Blair J and Roberts Betty
Current Estimated Value
Purchase Details
Closed on
Jan 24, 2012
Sold by
Roberts Betty and Cook James A
Bought by
Stueven Blair J
Purchase Details
Closed on
Jan 20, 2012
Sold by
Cook James A
Bought by
Stueven Blair J and Roberts Betty
Purchase Details
Closed on
Jul 26, 2011
Sold by
Hendrix Leamon E and Hendrix Jan
Bought by
Cook Della W and Cook James A
Purchase Details
Closed on
Jun 17, 2011
Sold by
Boyd Rhona and Boyd William
Bought by
Cook Della W and Cook James A
Purchase Details
Closed on
Apr 13, 2011
Sold by
Hendriz Euwell A
Bought by
Cook Della W and Cook James A
Purchase Details
Closed on
Apr 12, 2011
Sold by
Hendrix Leamon E and Hendrix Jan
Bought by
Cook Della W and Cook James A
Create a Home Valuation Report for This Property
The Home Valuation Report is an in-depth analysis detailing your home's value as well as a comparison with similar homes in the area
Home Values in the Area
Average Home Value in this Area
Purchase History
| Date | Buyer | Sale Price | Title Company |
|---|---|---|---|
| Stueven Blair J | -- | -- | |
| Stueven Blair J | -- | -- | |
| Stueven Blair J | -- | -- | |
| Stueven Blair J | -- | -- | |
| Cook Della W | -- | -- | |
| Cook Della W | -- | -- | |
| Cook Della W | -- | -- | |
| Cook Della W | -- | -- | |
| Cook Della W | -- | -- | |
| Cook Della W | -- | -- | |
| Cook Della W | -- | -- | |
| Cook Della W | -- | -- | |
| Cook Della W | -- | -- | |
| Cook Della W | -- | -- | |
| Cook Della W | -- | -- | |
| Cook Della W | -- | -- |
Source: Public Records
Tax History Compared to Growth
Tax History
| Year | Tax Paid | Tax Assessment Tax Assessment Total Assessment is a certain percentage of the fair market value that is determined by local assessors to be the total taxable value of land and additions on the property. | Land | Improvement |
|---|---|---|---|---|
| 2025 | $12 | $8,349 | $1,701 | $6,648 |
| 2024 | $12 | $8,298 | $1,380 | $6,918 |
| 2023 | $1,138 | $7,602 | $1,202 | $6,400 |
| 2022 | $957 | $6,540 | $1,202 | $5,338 |
| 2021 | $957 | $5,946 | $1,202 | $4,744 |
| 2020 | $939 | $5,742 | $1,202 | $4,540 |
| 2019 | $957 | $5,742 | $1,202 | $4,540 |
| 2018 | $951 | $5,727 | $1,202 | $4,525 |
| 2017 | $939 | $5,624 | $1,202 | $4,422 |
| 2014 | -- | $28,100 | $10,630 | $17,470 |
Source: Public Records
Map
Nearby Homes