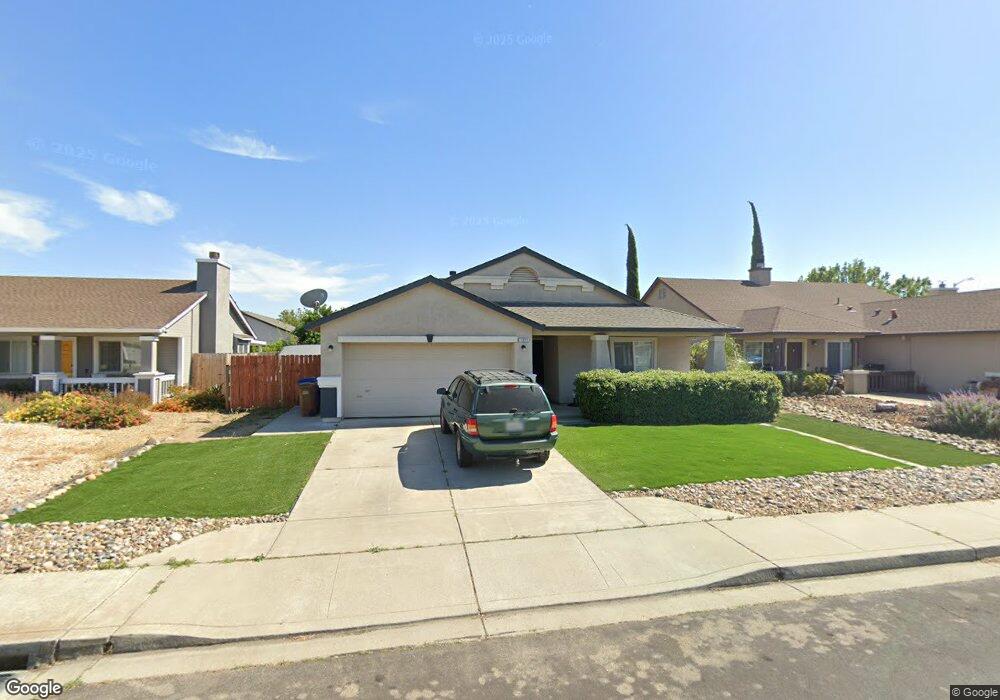
1221 Fetzer Ln Oakley, CA 94561
Estimated Value: $555,000 - $603,000
3
Beds
2
Baths
1,402
Sq Ft
$414/Sq Ft
Est. Value
About This Home
This home is located at 1221 Fetzer Ln, Oakley, CA 94561 and is currently estimated at $580,414, approximately $413 per square foot. 1221 Fetzer Ln is a home located in Contra Costa County with nearby schools including Vintage Parkway Elementary School, Delta Vista Middle School, and Freedom High School.
Ownership History
Date
Name
Owned For
Owner Type
Purchase Details
Closed on
Sep 17, 2001
Sold by
Garza Mary C
Bought by
Dean Mary Esther and Garza Mary C
Current Estimated Value
Purchase Details
Closed on
Jul 17, 2001
Sold by
Gogna Anthony C
Bought by
Garza Mary C
Home Financials for this Owner
Home Financials are based on the most recent Mortgage that was taken out on this home.
Original Mortgage
$65,000
Outstanding Balance
$25,068
Interest Rate
7.15%
Mortgage Type
Purchase Money Mortgage
Estimated Equity
$555,346
Purchase Details
Closed on
Mar 17, 1999
Sold by
Oakley Avalon Lp
Bought by
Gogna Anthony C
Home Financials for this Owner
Home Financials are based on the most recent Mortgage that was taken out on this home.
Original Mortgage
$154,791
Interest Rate
6.73%
Mortgage Type
Purchase Money Mortgage
Create a Home Valuation Report for This Property
The Home Valuation Report is an in-depth analysis detailing your home's value as well as a comparison with similar homes in the area
Home Values in the Area
Average Home Value in this Area
Purchase History
| Date | Buyer | Sale Price | Title Company |
|---|---|---|---|
| Dean Mary Esther | -- | -- | |
| Garza Mary C | $249,000 | First California Title Compa | |
| Gogna Anthony C | $181,000 | Old Republic Title Company |
Source: Public Records
Mortgage History
| Date | Status | Borrower | Loan Amount |
|---|---|---|---|
| Open | Garza Mary C | $65,000 | |
| Previous Owner | Gogna Anthony C | $154,791 |
Source: Public Records
Tax History
| Year | Tax Paid | Tax Assessment Tax Assessment Total Assessment is a certain percentage of the fair market value that is determined by local assessors to be the total taxable value of land and additions on the property. | Land | Improvement |
|---|---|---|---|---|
| 2025 | $5,049 | $367,825 | $118,172 | $249,653 |
| 2024 | $4,905 | $360,613 | $115,855 | $244,758 |
| 2023 | $4,905 | $353,543 | $113,584 | $239,959 |
| 2022 | $4,866 | $346,611 | $111,357 | $235,254 |
| 2021 | $4,785 | $339,816 | $109,174 | $230,642 |
| 2019 | $4,524 | $329,739 | $105,937 | $223,802 |
| 2018 | $4,409 | $323,274 | $103,860 | $219,414 |
| 2017 | $4,371 | $316,936 | $101,824 | $215,112 |
| 2016 | $4,143 | $310,723 | $99,828 | $210,895 |
| 2015 | $4,167 | $306,057 | $98,329 | $207,728 |
| 2014 | $3,876 | $278,500 | $89,476 | $189,024 |
Source: Public Records
Map
Nearby Homes
- 201 Ohara Ave
- 1 Bradford Island Rd
- 620 Almond Dr
- 0 Almond Dr Unit 41106452
- 4620 Duarte Ave
- 0 Main St Unit 41115212
- 4863 Bayside Way
- 4920 Dawson Dr
- 330 W Cypress Rd
- 1425 W Cypress Rd
- 912 Rhine Way
- 1765 Delta Meadows Way
- 4855 Edgewood Ct
- 5301 Delta Ranch Dr
- 354 Hazelnut Ln
- 10 Da Vinci Ct
- 30 Vignola Ct
- 3901-B Rose Ave
- 1781 Chandon Way
- 5025 Martin St
- 1217 Fetzer Ln
- 1225 Fetzer Ln
- 1240 Walnut Meadows Dr
- 1244 Walnut Meadows Dr
- 1236 Walnut Meadows Dr
- 1213 Fetzer Ln
- 1229 Fetzer Ln
- 1222 Fetzer Ln
- 1232 Walnut Meadows Dr
- 1248 Walnut Meadows Dr
- 1209 Fetzer Ln
- 1214 Fetzer Ln
- 1230 Fetzer Ln
- 1228 Walnut Meadows Dr
- 1210 Fetzer Ln
- 1205 Fetzer Ln
- 1233 Fetzer Ln
- 1241 Walnut Meadows Dr
- 1224 Walnut Meadows Dr
- 1237 Walnut Meadows Dr Unit 9
Your Personal Tour Guide
Ask me questions while you tour the home.