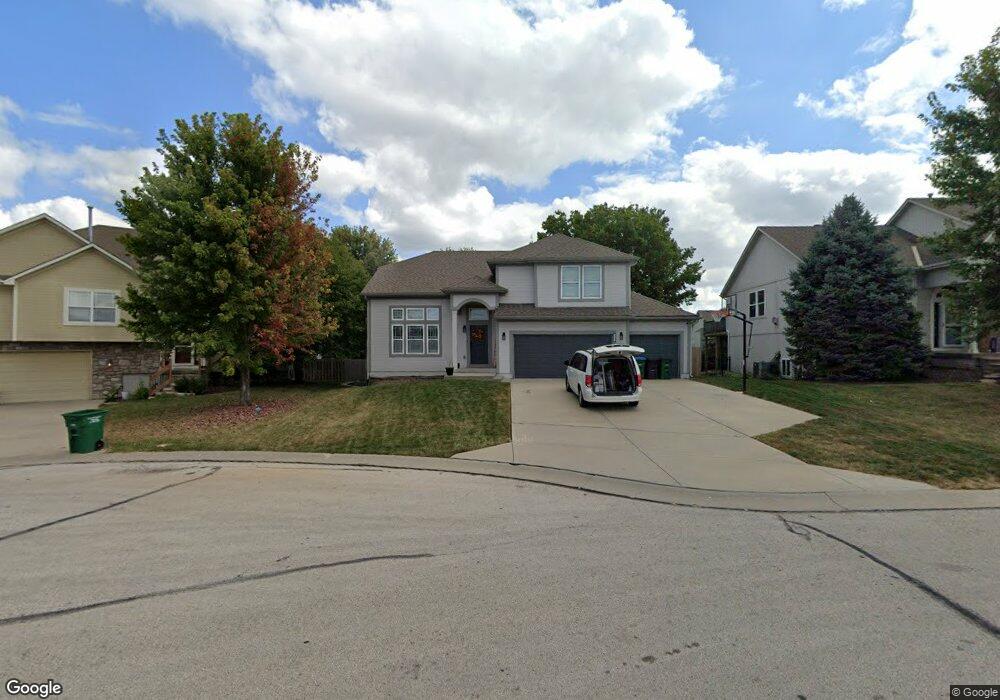
1221 SW Nagona Ln Lees Summit, MO 64082
Estimated Value: $382,380 - $484,000
3
Beds
4
Baths
1,519
Sq Ft
$278/Sq Ft
Est. Value
About This Home
This home is located at 1221 SW Nagona Ln, Lees Summit, MO 64082 and is currently estimated at $422,595, approximately $278 per square foot. 1221 SW Nagona Ln is a home located in Jackson County with nearby schools including Summit Pointe Elementary School, Summit Lakes Middle School, and Lee's Summit West High School.
Ownership History
Date
Name
Owned For
Owner Type
Purchase Details
Closed on
Jan 2, 2013
Sold by
Dhkc Inc
Bought by
Lejeune Amanda B
Current Estimated Value
Home Financials for this Owner
Home Financials are based on the most recent Mortgage that was taken out on this home.
Original Mortgage
$206,196
Interest Rate
3.5%
Mortgage Type
FHA
Purchase Details
Closed on
Sep 13, 2012
Sold by
Distinctive Homes Of Kansas City Inc
Bought by
Dhkc Inc
Home Financials for this Owner
Home Financials are based on the most recent Mortgage that was taken out on this home.
Original Mortgage
$170,000
Interest Rate
3.66%
Mortgage Type
Future Advance Clause Open End Mortgage
Purchase Details
Closed on
Jun 15, 2005
Sold by
Kinmarsor Llc
Bought by
Distinctive Homes Of Kansas City Inc
Home Financials for this Owner
Home Financials are based on the most recent Mortgage that was taken out on this home.
Original Mortgage
$181,600
Interest Rate
5.78%
Mortgage Type
Construction
Create a Home Valuation Report for This Property
The Home Valuation Report is an in-depth analysis detailing your home's value as well as a comparison with similar homes in the area
Home Values in the Area
Average Home Value in this Area
Purchase History
| Date | Buyer | Sale Price | Title Company |
|---|---|---|---|
| Lejeune Amanda B | -- | Midwest Title Company Inc | |
| Dhkc Inc | -- | None Available | |
| Distinctive Homes Of Kansas City Inc | -- | First American Title Ins Co |
Source: Public Records
Mortgage History
| Date | Status | Borrower | Loan Amount |
|---|---|---|---|
| Previous Owner | Lejeune Amanda B | $206,196 | |
| Previous Owner | Dhkc Inc | $170,000 | |
| Previous Owner | Distinctive Homes Of Kansas City Inc | $181,600 |
Source: Public Records
Tax History Compared to Growth
Tax History
| Year | Tax Paid | Tax Assessment Tax Assessment Total Assessment is a certain percentage of the fair market value that is determined by local assessors to be the total taxable value of land and additions on the property. | Land | Improvement |
|---|---|---|---|---|
| 2025 | $4,244 | $67,594 | $12,692 | $54,902 |
| 2024 | $4,213 | $58,778 | $10,788 | $47,990 |
| 2023 | $4,213 | $58,778 | $7,805 | $50,973 |
| 2022 | $4,509 | $55,860 | $8,987 | $46,873 |
| 2021 | $4,603 | $55,860 | $8,987 | $46,873 |
| 2020 | $4,433 | $53,273 | $8,987 | $44,286 |
| 2019 | $4,312 | $53,273 | $8,987 | $44,286 |
| 2018 | $1,672,762 | $48,438 | $5,580 | $42,858 |
| 2017 | $4,224 | $48,438 | $5,580 | $42,858 |
| 2016 | $3,782 | $42,921 | $7,068 | $35,853 |
| 2014 | $3,433 | $30,471 | $7,315 | $23,156 |
Source: Public Records
Map
Nearby Homes
- 1022 SW Cheshire Dr
- 4400 SW Rivulet Dr
- 1021 SW Cheshire Dr
- 4520 SW Berkshire Dr
- 4510 SW Fenwick Rd
- 4605 SW Olympia Cir
- 4528 SW Berkshire Dr
- 4624 SW Robinson Dr
- 4628 SW Robinson Dr
- 1100 SW Blackpool Dr
- 4641 SW Soldier Dr
- 4647 SW Olympia Place
- 4120 SW Flintrock Dr
- 4104 SW Flintrock Dr
- Serenade Plan at Stoney Creek - Bliss Collection
- Oasis Plan at Stoney Creek - Bliss Collection
- Devotion Plan at Stoney Creek - Bliss Collection
- Brookside Plan at Stoney Creek - Premier Collection
- Serenity Plan at Stoney Creek - Bliss Collection
- Avalon Plan at Stoney Creek - Premier Collection
- 1217 SW Nagona Ln
- 1225 SW Nagona Ln
- 1213 SW Nagona Ln
- 4440 SW Rivulet Dr
- 4436 SW Rivulet Dr
- 1236 SW Nagona Ln
- 4444 SW Rivulet Dr
- 1233 SW Nagona Ln
- 4432 SW Rivulet Dr
- 4448 SW Rivulet Dr
- 1209 SW Nagona Ln
- 1206 SW Nagona Ln
- 1240 SW Nagona Ln
- 1237 SW Nagona Ln
- 4437 SW Rivulet Dr
- 4428 SW Rivulet Dr
- 4433 SW Rivulet Dr
- 4441 SW Rivulet Dr
- 4445 SW Rivulet Dr
- 1241 SW Nagona Ln