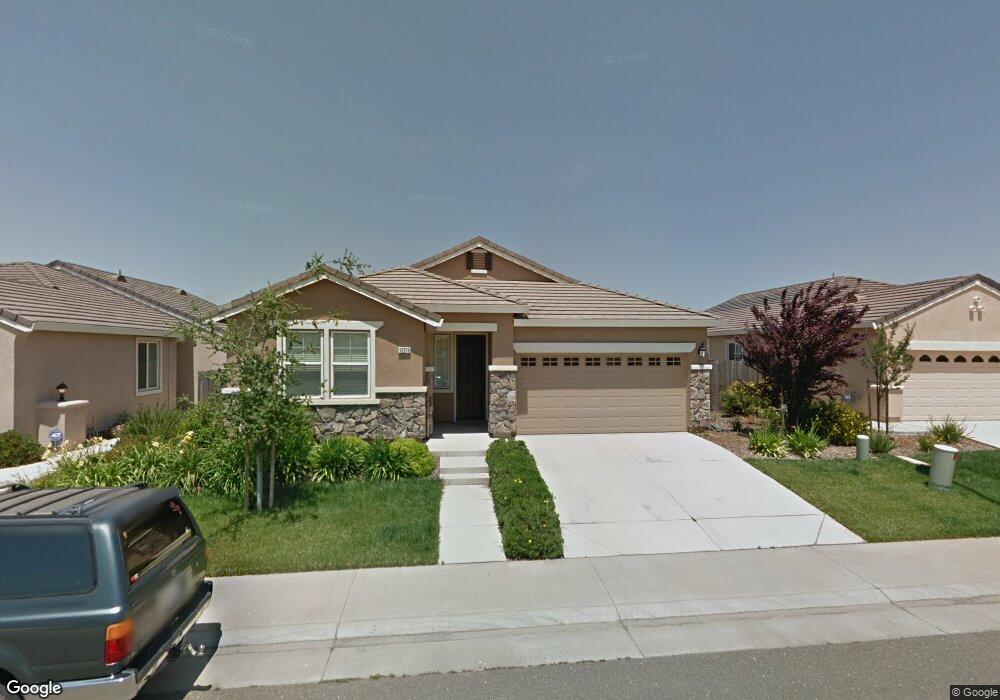
12219 Cedar Bog Way Unit lot46 Rancho Cordova, CA 95742
Sunridge Park NeighborhoodEstimated Value: $523,000 - $552,000
3
Beds
2
Baths
1,646
Sq Ft
$329/Sq Ft
Est. Value
About This Home
This home is located at 12219 Cedar Bog Way Unit lot46, Rancho Cordova, CA 95742 and is currently estimated at $541,725, approximately $329 per square foot. 12219 Cedar Bog Way Unit lot46 is a home located in Sacramento County with nearby schools including Sunrise Elementary School, Katherine L. Albiani Middle School, and Pleasant Grove High School.
Ownership History
Date
Name
Owned For
Owner Type
Purchase Details
Closed on
Aug 10, 2019
Sold by
Mazzola Robert and Mazzola Elyse
Bought by
Mazzola Vince
Current Estimated Value
Home Financials for this Owner
Home Financials are based on the most recent Mortgage that was taken out on this home.
Original Mortgage
$218,700
Outstanding Balance
$191,541
Interest Rate
3.7%
Mortgage Type
New Conventional
Estimated Equity
$350,184
Purchase Details
Closed on
Jul 23, 2010
Sold by
Woodside 05N Lp
Bought by
Mazzola Robert and Mazzola Vince
Home Financials for this Owner
Home Financials are based on the most recent Mortgage that was taken out on this home.
Original Mortgage
$249,904
Interest Rate
3.87%
Mortgage Type
FHA
Purchase Details
Closed on
Apr 4, 2008
Sold by
Woodside Vistas Inc
Bought by
Woodside Bella Brisas Inc
Create a Home Valuation Report for This Property
The Home Valuation Report is an in-depth analysis detailing your home's value as well as a comparison with similar homes in the area
Home Values in the Area
Average Home Value in this Area
Purchase History
| Date | Buyer | Sale Price | Title Company |
|---|---|---|---|
| Mazzola Vince | -- | Placer Title Company | |
| Mazzola Robert | $253,500 | Placer Title Company | |
| Woodside Bella Brisas Inc | -- | None Available |
Source: Public Records
Mortgage History
| Date | Status | Borrower | Loan Amount |
|---|---|---|---|
| Open | Mazzola Vince | $218,700 | |
| Closed | Mazzola Robert | $249,904 |
Source: Public Records
Tax History Compared to Growth
Tax History
| Year | Tax Paid | Tax Assessment Tax Assessment Total Assessment is a certain percentage of the fair market value that is determined by local assessors to be the total taxable value of land and additions on the property. | Land | Improvement |
|---|---|---|---|---|
| 2025 | $6,042 | $375,638 | $128,265 | $247,373 |
| 2024 | $6,042 | $368,273 | $125,750 | $242,523 |
| 2023 | $5,909 | $361,053 | $123,285 | $237,768 |
| 2022 | $5,831 | $353,974 | $120,868 | $233,106 |
| 2021 | $5,727 | $347,035 | $118,499 | $228,536 |
| 2020 | $5,659 | $343,477 | $117,284 | $226,193 |
| 2019 | $5,087 | $291,139 | $97,619 | $193,520 |
| 2018 | $5,651 | $285,431 | $95,705 | $189,726 |
| 2017 | $5,538 | $279,835 | $93,829 | $186,006 |
| 2016 | $5,324 | $274,349 | $91,990 | $182,359 |
| 2015 | $5,217 | $270,229 | $90,609 | $179,620 |
| 2014 | $5,120 | $264,937 | $88,835 | $176,102 |
Source: Public Records
Map
Nearby Homes
- 12205 Hetch Hechy Dr
- 4074 Timberland Dr
- 12219 Alamosa Dr
- 12304 Pawcatuck Way
- 12217 Alamosa Dr
- 4292 Aura Way
- 4284 Aura Way
- 4280 Aura Way
- 4159 Aura Way
- 4155 Aura Way
- 12315 Pawcatuck Way
- 4131 Aura Way
- 12137 Wistar Way
- 4156 Aura Way
- 12264 Rocky Ford Way
- Gunnison Plan at Montrose at The Ranch
- Boone Plan at Montrose at The Ranch
- 12204 Paint Horse Ct
- 12198 Encanto Way
- 12362 Rocky Ford Ct
- 12219 Cedar Bog Way
- 12223 Cedar Bog Way Unit lot47
- 12223 Cedar Bog Way
- 12215 Cedar Bog Way Unit lot45
- 12215 Cedar Bog Way
- 4287 Borderlands Dr Unit lot41
- 12227 Cedar Bog Way Unit lot48
- 12227 Cedar Bog Way
- 12211 Cedar Bog Way Unit lot44
- 12211 Cedar Bog Way
- 4291 Borderlands Dr Unit lot42
- 4291 Borderlands Dr
- 4283 Borderlands Dr Unit lot40
- 4283 Borderlands Dr
- 12218 Cedar Bog Way
- 4295 Borderlands Dr Unit lot43
- 12222 Cedar Bog Way Unit lot66
- 12222 Cedar Bog Way
- 12214 Cedar Bog Way Unit lot68
- 12214 Cedar Bog Way