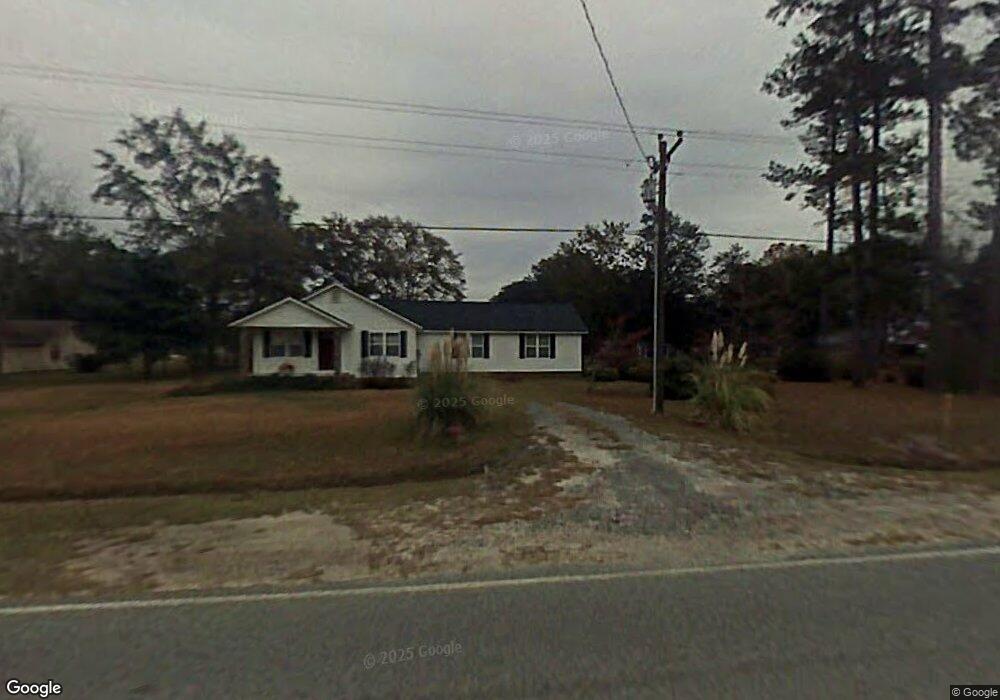
1222 Freedman Grove Rd Fleming, GA 31309
Estimated Value: $181,556 - $367,000
2
Beds
1
Bath
2,009
Sq Ft
$133/Sq Ft
Est. Value
About This Home
This home is located at 1222 Freedman Grove Rd, Fleming, GA 31309 and is currently estimated at $268,139, approximately $133 per square foot. 1222 Freedman Grove Rd is a home located in Liberty County with nearby schools including Liberty Elementary School, Midway Middle School, and Liberty County High School.
Ownership History
Date
Name
Owned For
Owner Type
Purchase Details
Closed on
Jun 26, 2017
Sold by
Crowley Paul A
Bought by
Crowley Paul A and Crowley Paula B
Current Estimated Value
Home Financials for this Owner
Home Financials are based on the most recent Mortgage that was taken out on this home.
Original Mortgage
$81,039
Outstanding Balance
$42,871
Interest Rate
3.95%
Mortgage Type
New Conventional
Estimated Equity
$225,268
Purchase Details
Closed on
Nov 23, 2005
Sold by
Crowley Paula B
Bought by
Crowley Paul A
Home Financials for this Owner
Home Financials are based on the most recent Mortgage that was taken out on this home.
Original Mortgage
$55,000
Interest Rate
5.66%
Mortgage Type
New Conventional
Purchase Details
Closed on
Jan 25, 2000
Sold by
Blount Paula B
Bought by
Crowley Paula B
Purchase Details
Closed on
Jul 28, 1989
Bought by
Crowley Paula B
Purchase Details
Closed on
Jan 1, 1966
Bought by
Barnett Ray and Barnett Mary
Create a Home Valuation Report for This Property
The Home Valuation Report is an in-depth analysis detailing your home's value as well as a comparison with similar homes in the area
Home Values in the Area
Average Home Value in this Area
Purchase History
| Date | Buyer | Sale Price | Title Company |
|---|---|---|---|
| Crowley Paul A | -- | -- | |
| Crowley Paul A | -- | -- | |
| Crowley Paula B | -- | -- | |
| Crowley Paula B | -- | -- | |
| Crowley Paula B | -- | -- | |
| Barnett Ray | -- | -- |
Source: Public Records
Mortgage History
| Date | Status | Borrower | Loan Amount |
|---|---|---|---|
| Open | Crowley Paul A | $81,039 | |
| Previous Owner | Crowley Paula B | $55,000 |
Source: Public Records
Tax History Compared to Growth
Tax History
| Year | Tax Paid | Tax Assessment Tax Assessment Total Assessment is a certain percentage of the fair market value that is determined by local assessors to be the total taxable value of land and additions on the property. | Land | Improvement |
|---|---|---|---|---|
| 2024 | $1,798 | $39,216 | $3,026 | $36,190 |
| 2023 | $1,798 | $34,738 | $3,026 | $31,712 |
| 2022 | $1,312 | $29,582 | $3,026 | $26,556 |
| 2021 | $1,234 | $27,650 | $3,026 | $24,624 |
| 2020 | $1,248 | $28,150 | $3,026 | $25,124 |
| 2019 | $1,238 | $28,650 | $3,026 | $25,624 |
| 2018 | $1,244 | $29,150 | $3,026 | $26,124 |
| 2017 | $976 | $29,650 | $3,026 | $26,624 |
| 2016 | $1,203 | $30,150 | $3,026 | $27,124 |
| 2015 | $1,079 | $29,452 | $2,328 | $27,124 |
| 2014 | $1,079 | $31,269 | $2,592 | $28,677 |
| 2013 | -- | $30,428 | $1,185 | $29,243 |
Source: Public Records
Map
Nearby Homes
- 1200 Freedman Grove Rd
- 1178 Freedman Grove Rd
- 1249 Freedman Grove Rd
- 1233 Freedman Grove Rd
- 1209 Freedman Grove Rd
- 1158 Freedman Grove Rd
- 0 Freedman Grove Rd
- 70 Phillipsville Rd
- 1107 Freedman Grove Rd
- 88 Rosa Rd
- Lot #1 Freedman Grove Rd
- 0 Freedman Grove Rd
- 184 Dusty Rd
- 1413 Freedman Grove Rd
- 234 Phillipsville Rd
- 1467 Freedman Grove Rd
- 1326 Freedman Grove Rd
- 1481 Freedman Grove Rd
- 312 Phillipsville Rd
- 870 Freedman Grove Rd