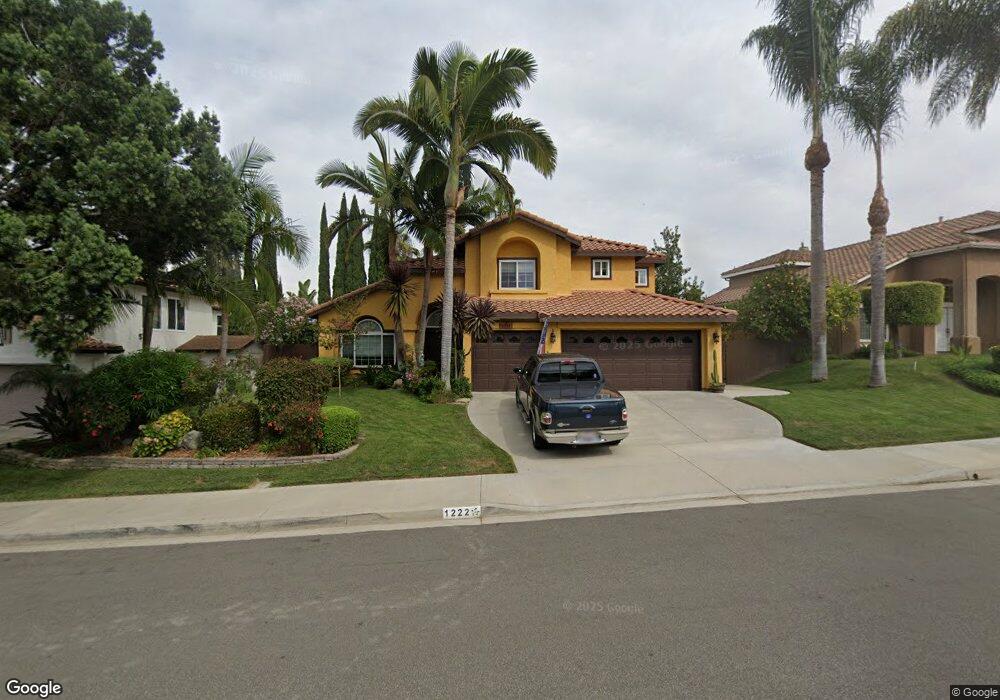
1222 Sunglow Dr Oceanside, CA 92056
Guajome NeighborhoodEstimated Value: $1,003,000 - $1,084,000
4
Beds
3
Baths
2,172
Sq Ft
$478/Sq Ft
Est. Value
About This Home
This home is located at 1222 Sunglow Dr, Oceanside, CA 92056 and is currently estimated at $1,038,277, approximately $478 per square foot. 1222 Sunglow Dr is a home located in San Diego County with nearby schools including Empresa Elementary School, Roosevelt Middle School, and Vista High School.
Ownership History
Date
Name
Owned For
Owner Type
Purchase Details
Closed on
May 26, 2004
Sold by
Miller Robert M and Miller Sandra M
Bought by
Miller Robert M and Miller Sandra M
Current Estimated Value
Purchase Details
Closed on
Jul 26, 1996
Sold by
Miller Robert M and Miller Sandra
Bought by
Miller Robert M and Miller Sandra M
Purchase Details
Closed on
Apr 29, 1996
Sold by
Parker and Zaida
Bought by
Miller Robert M and Miller Sandra
Home Financials for this Owner
Home Financials are based on the most recent Mortgage that was taken out on this home.
Original Mortgage
$202,980
Interest Rate
8.32%
Mortgage Type
VA
Purchase Details
Closed on
Apr 29, 1994
Sold by
Kaufman & Broad Of San Diego Inc
Bought by
Parker Michael and Parker Zaida
Home Financials for this Owner
Home Financials are based on the most recent Mortgage that was taken out on this home.
Original Mortgage
$147,100
Interest Rate
7.79%
Create a Home Valuation Report for This Property
The Home Valuation Report is an in-depth analysis detailing your home's value as well as a comparison with similar homes in the area
Home Values in the Area
Average Home Value in this Area
Purchase History
| Date | Buyer | Sale Price | Title Company |
|---|---|---|---|
| Miller Robert M | -- | -- | |
| Miller Robert M | -- | First American Title | |
| Miller Robert M | $199,000 | First American Title | |
| Parker Michael | $184,000 | First American Title |
Source: Public Records
Mortgage History
| Date | Status | Borrower | Loan Amount |
|---|---|---|---|
| Previous Owner | Miller Robert M | $202,980 | |
| Previous Owner | Parker Michael | $147,100 |
Source: Public Records
Tax History
| Year | Tax Paid | Tax Assessment Tax Assessment Total Assessment is a certain percentage of the fair market value that is determined by local assessors to be the total taxable value of land and additions on the property. | Land | Improvement |
|---|---|---|---|---|
| 2025 | $3,731 | $324,077 | $81,356 | $242,721 |
| 2024 | $3,731 | $317,723 | $79,761 | $237,962 |
| 2023 | $3,639 | $311,495 | $78,198 | $233,297 |
| 2022 | $3,620 | $305,388 | $76,665 | $228,723 |
| 2021 | $3,536 | $299,401 | $75,162 | $224,239 |
| 2020 | $3,520 | $296,332 | $74,392 | $221,940 |
| 2019 | $3,465 | $290,523 | $72,934 | $217,589 |
| 2018 | $3,299 | $284,827 | $71,504 | $213,323 |
| 2017 | $3,234 | $279,243 | $70,102 | $209,141 |
| 2016 | $3,157 | $273,769 | $68,728 | $205,041 |
| 2015 | $3,139 | $269,658 | $67,696 | $201,962 |
| 2014 | $3,064 | $264,376 | $66,370 | $198,006 |
Source: Public Records
Map
Nearby Homes
- 1247 Sunglow Dr
- 1303 Darwin Dr
- 1162 Sagewood Dr
- 475 Taylor Dr
- 241 Richard Ct
- 1413 Eastview Ct
- 1376 Darwin Dr
- 1400 Darwin Dr
- 5216 Palmera Dr
- 1433 Grey Oaks Ct
- 5259 Hubbert St
- 1508 Laurelwood Way
- 1351 Cottonwood Dr
- 1513 Powell Rd
- 1517 Leonis Place
- 5177 Loma Verde
- 1704 Laurelwood Way
- 1728 Valley Oak Way
- 1715 Crabapple Way
- 1515 Fig Tree Way
- 1218 Sunglow Dr
- 1228 Sunglow Dr
- 1215 Sunbright Dr
- 1209 Sunbright Dr
- 1214 Sunglow Dr
- 1234 Sunglow Dr
- 1219 Sunbright Dr
- 1223 Sunglow Dr
- 1205 Sunbright Dr
- 1227 Sunglow Dr
- 1231 Sunglow Dr
- 1238 Sunglow Dr
- 1215 Sunglow Dr
- 1225 Sunbright Dr
- 1209 Sunglow Dr
- 1201 Sunbright Dr
- 1242 Sunglow Dr
- 1204 Sunglow Dr
- 1235 Sunglow Dr
- 1229 Sunbright Dr
Your Personal Tour Guide
Ask me questions while you tour the home.