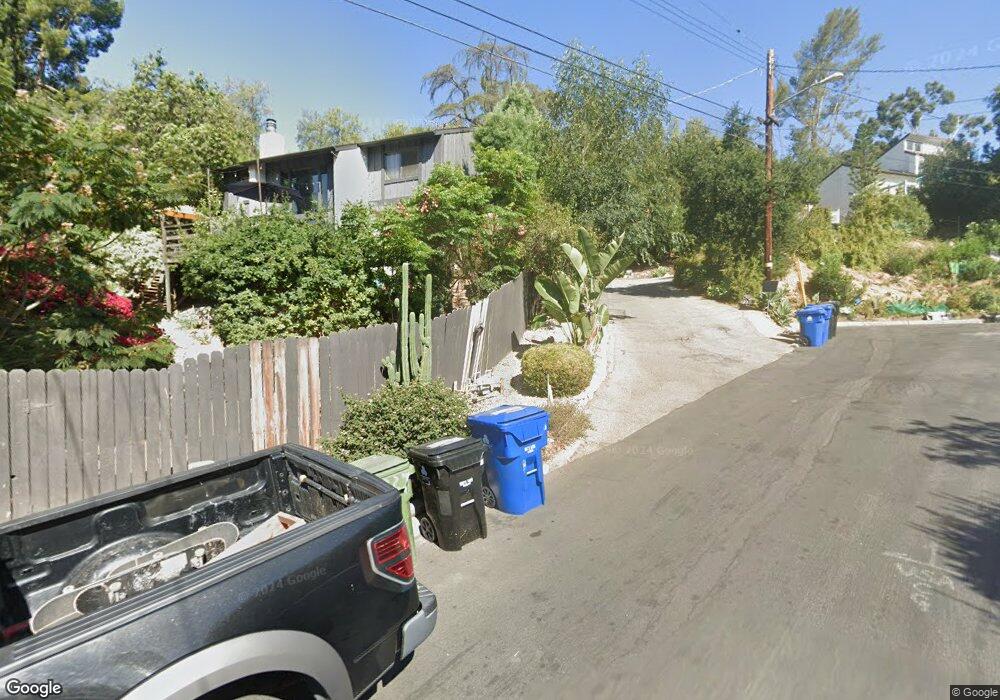
1223 N Avenue 63 Los Angeles, CA 90042
Estimated Value: $1,564,000 - $2,397,211
3
Beds
3
Baths
3,080
Sq Ft
$584/Sq Ft
Est. Value
About This Home
This home is located at 1223 N Avenue 63, Los Angeles, CA 90042 and is currently estimated at $1,797,803, approximately $583 per square foot. 1223 N Avenue 63 is a home located in Los Angeles County with nearby schools including Annandale Elementary, Luther Burbank Middle School, and Eagle Rock High School.
Ownership History
Date
Name
Owned For
Owner Type
Purchase Details
Closed on
Aug 1, 2013
Sold by
Kelly James P and Bickmore Beverlee Z
Bought by
Kelly James P and Bickmore Beverlee
Current Estimated Value
Purchase Details
Closed on
May 3, 1995
Sold by
Bickmore Beverlee Z and Zwerdling Beverlee B
Bought by
Kelly James P and Bickmore Beverlee Z
Home Financials for this Owner
Home Financials are based on the most recent Mortgage that was taken out on this home.
Original Mortgage
$260,000
Interest Rate
8.46%
Purchase Details
Closed on
Oct 12, 1993
Sold by
Zwerdling Beverlee B and Bickmore Beverlee Z
Bought by
Kelly James P and Zwerdling Beverlee B
Home Financials for this Owner
Home Financials are based on the most recent Mortgage that was taken out on this home.
Original Mortgage
$300,000
Interest Rate
6.94%
Create a Home Valuation Report for This Property
The Home Valuation Report is an in-depth analysis detailing your home's value as well as a comparison with similar homes in the area
Home Values in the Area
Average Home Value in this Area
Purchase History
| Date | Buyer | Sale Price | Title Company |
|---|---|---|---|
| Kelly James P | -- | None Available | |
| Kelly James P | -- | First American Title Company | |
| Kelly James P | -- | Orange Coast Title |
Source: Public Records
Mortgage History
| Date | Status | Borrower | Loan Amount |
|---|---|---|---|
| Closed | Kelly James P | $260,000 | |
| Closed | Kelly James P | $300,000 |
Source: Public Records
Tax History Compared to Growth
Tax History
| Year | Tax Paid | Tax Assessment Tax Assessment Total Assessment is a certain percentage of the fair market value that is determined by local assessors to be the total taxable value of land and additions on the property. | Land | Improvement |
|---|---|---|---|---|
| 2025 | $3,761 | $265,177 | $46,303 | $218,874 |
| 2024 | $3,761 | $259,979 | $45,396 | $214,583 |
| 2023 | $3,699 | $254,882 | $44,506 | $210,376 |
| 2022 | $3,551 | $249,885 | $43,634 | $206,251 |
| 2021 | $3,493 | $244,986 | $42,779 | $202,207 |
| 2020 | $3,518 | $242,475 | $42,341 | $200,134 |
| 2019 | $3,402 | $237,721 | $41,511 | $196,210 |
| 2018 | $3,233 | $233,061 | $40,698 | $192,363 |
| 2016 | $3,067 | $224,013 | $39,118 | $184,895 |
| 2015 | $3,027 | $220,649 | $38,531 | $182,118 |
| 2014 | $3,081 | $216,328 | $37,777 | $178,551 |
Source: Public Records
Map
Nearby Homes
- 1465 Washburn Rd
- 6150 Strickland Ave
- 6155 Poppy Peak Dr
- 1124 Highgrove Terrace
- 1450 La Loma Rd
- 6134 Strickland Ave
- 523 Oleander Dr
- 1525 La Loma Rd
- 6119 Strickland Ave
- 6149 Annan Way
- 6849 N Figueroa St
- 1457 Cheviotdale Dr
- 6048 Burwood Ave
- 6050 Burwood Ave
- 1256 Club House Dr
- 940 Burleigh Dr
- 1726 La Loma Rd
- 6218 Saylin Ln
- 1705 La Loma Rd
- 1522 N Mercury Dr
- 6270 Burwood Ave
- 1229 N Avenue 63
- 6277 Burwood Ave
- 659 Oleander Dr
- 6264 Burwood Ave
- 6273 Burwood Ave
- 1235 N Avenue 63
- 6269 Burwood Ave
- 665 Oleander Dr
- 6265 Burwood Ave
- 1215 N Avenue 63
- 6300 Strickland Ave
- 6251 Burwood Ave
- 662 Burwood Terrace
- 668 Burwood Terrace
- 660 Burwood Terrace
- 672 Burwood Terrace
- 6268 Strickland Ave
- 1234 N Avenue 63
- 645 Marie Ave