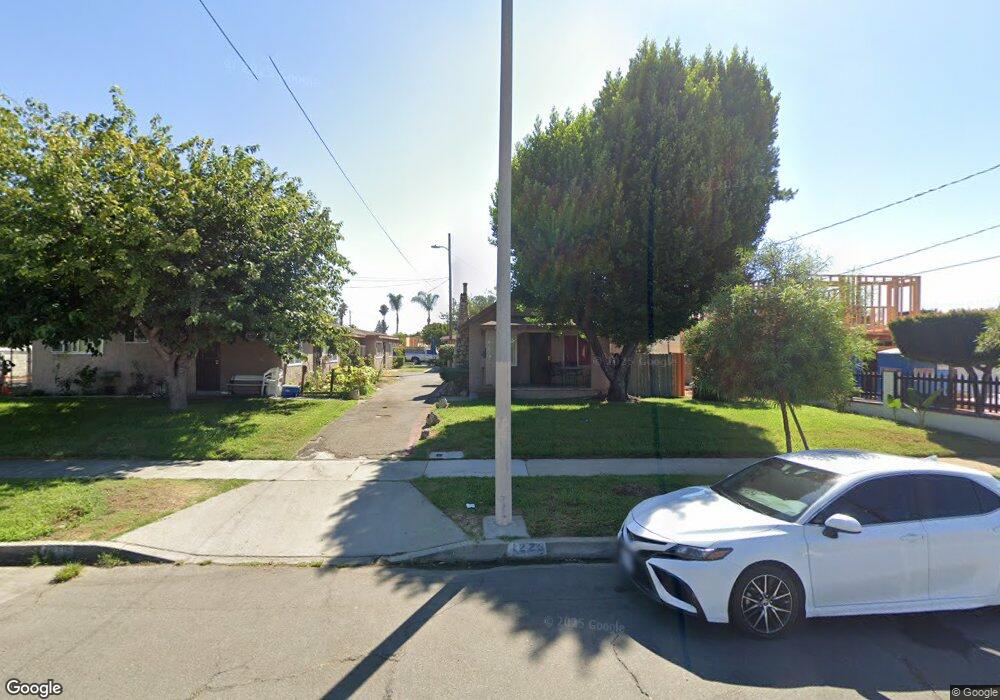
1223 S Oakland Ave Ontario, CA 91762
Downtown Ontario NeighborhoodEstimated Value: $495,648 - $758,000
4
Beds
2
Baths
1,699
Sq Ft
$357/Sq Ft
Est. Value
About This Home
This home is located at 1223 S Oakland Ave, Ontario, CA 91762 and is currently estimated at $606,412, approximately $356 per square foot. 1223 S Oakland Ave is a home located in San Bernardino County with nearby schools including Richard Haynes Elementary, Oaks Middle, and Ontario High School.
Ownership History
Date
Name
Owned For
Owner Type
Purchase Details
Closed on
Aug 16, 2006
Sold by
Nijjar Swaranjit S and Nijjar Patricia D
Bought by
Group Viii Covina Properties Lp
Current Estimated Value
Home Financials for this Owner
Home Financials are based on the most recent Mortgage that was taken out on this home.
Original Mortgage
$25,000,000
Interest Rate
6.67%
Mortgage Type
Credit Line Revolving
Create a Home Valuation Report for This Property
The Home Valuation Report is an in-depth analysis detailing your home's value as well as a comparison with similar homes in the area
Home Values in the Area
Average Home Value in this Area
Purchase History
| Date | Buyer | Sale Price | Title Company |
|---|---|---|---|
| Group Viii Covina Properties Lp | -- | Ticor Title Company |
Source: Public Records
Mortgage History
| Date | Status | Borrower | Loan Amount |
|---|---|---|---|
| Previous Owner | Group Viii Covina Properties Lp | $25,000,000 |
Source: Public Records
Tax History Compared to Growth
Tax History
| Year | Tax Paid | Tax Assessment Tax Assessment Total Assessment is a certain percentage of the fair market value that is determined by local assessors to be the total taxable value of land and additions on the property. | Land | Improvement |
|---|---|---|---|---|
| 2025 | $1,834 | $169,260 | $36,794 | $132,466 |
| 2024 | $1,834 | $165,942 | $36,073 | $129,869 |
| 2023 | $1,783 | $162,689 | $35,366 | $127,323 |
| 2022 | $1,759 | $159,499 | $34,673 | $124,826 |
| 2021 | $1,748 | $156,371 | $33,993 | $122,378 |
| 2020 | $1,717 | $154,767 | $33,644 | $121,123 |
| 2019 | $1,703 | $151,732 | $32,984 | $118,748 |
| 2018 | $1,679 | $148,757 | $32,337 | $116,420 |
| 2017 | $1,619 | $145,840 | $31,703 | $114,137 |
| 2016 | $1,556 | $142,980 | $31,081 | $111,899 |
| 2015 | $1,545 | $140,832 | $30,614 | $110,218 |
| 2014 | $1,497 | $138,073 | $30,014 | $108,059 |
Source: Public Records
Map
Nearby Homes
- 559 W Belmont St
- 550 W Belmont St
- 646 W Belmont St
- 653 W Belmont St
- 410 W Maitland St
- 754 W Belmont St
- 1214 S Cypress Ave Unit G
- 718 S Vine Ave Unit A
- 1216 S Cypress Ave Unit E
- 1420 S Euclid Ave Unit A & B
- 1546 Redwood Ave
- 610 S Vine Ave
- 1031 S Palmetto Ave Unit N9
- 1031 S Palmetto Ave Unit W8
- 1031 S Palmetto Ave Unit II3
- 1031 S Palmetto Ave Unit N1
- 1209 S Palmetto Ave Unit C
- 850 W Mission Blvd
- 850 W Mission Blvd Unit A46
- 611 S Laurel Ave
- 1219 S Oakland Ave
- 1241 S Oakland Ave
- 558 W Phillips St
- 1217 S Oakland Ave
- 1249 S Oakland Ave
- 546 W Phillips St
- 1226 S Bonita Ct
- 544 W Phillips St
- 1251 S Oakland Ave
- 536 W Phillips St
- 1226 S Oakland Ave
- 1216 S Oakland Ave
- 604 W Phillips St
- 543 W Belmont St
- 551 W Belmont St
- 608 W Phillips St
- 539 W Belmont St
- 908 S Oakland Ave
- 603 W Belmont St
- 612 W Phillips St