


1223 W Olive St Unit 1225 Milwaukee, WI 53209
Rufus King NeighborhoodEstimated payment $1,215/month
About This Home
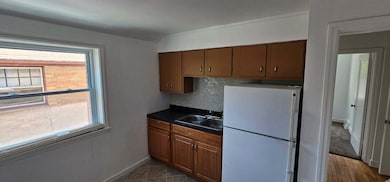
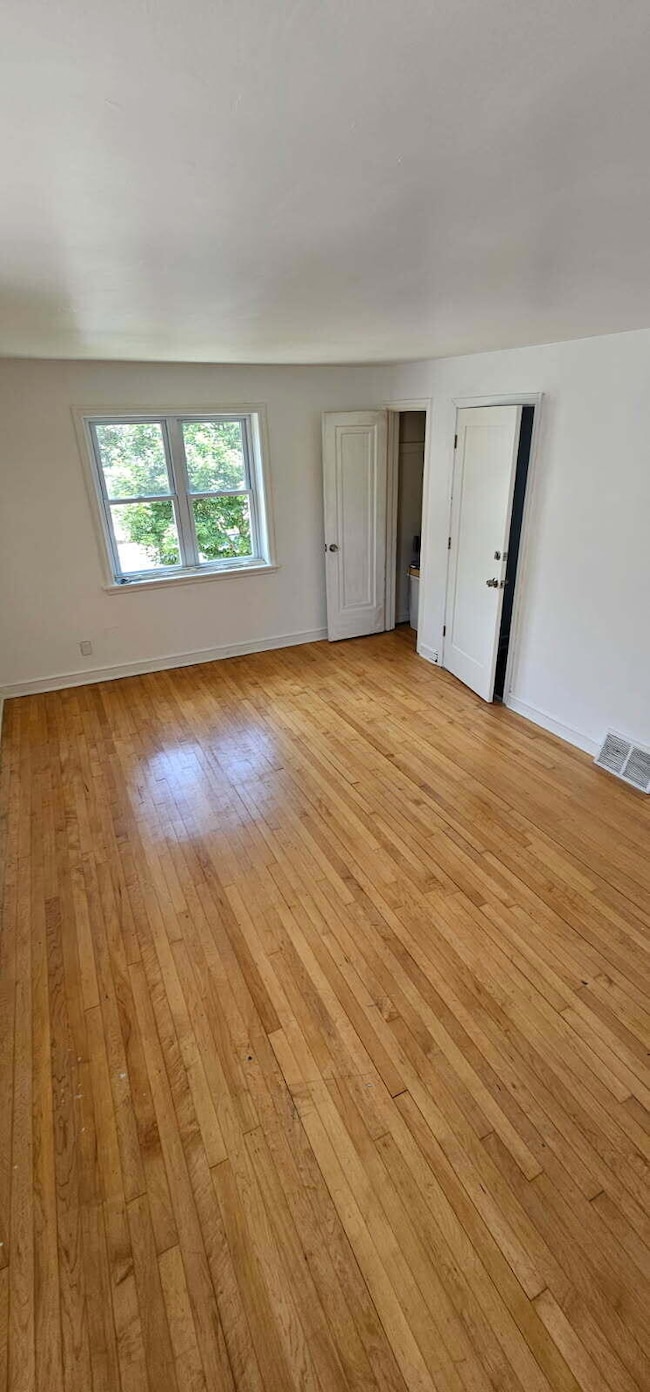
Sturdy brick Rufus King duplex. Updated bathrooms, hardwood floors and new windows throughout. Large yard, convenient to shopping, highway, East Side, Milwaukee River and local parks.

Property Details
Property Type
- Other
Est. Annual Taxes
- $3,232
Lot Details
- 5,227 Sq Ft Lot
Home Design
- 1,722 Sq Ft Home
- Brick Exterior Construction
Basement
- Basement Fills Entire Space Under The House
- Block Basement Construction
Community Details
- 2 Units
Listing and Financial Details
- Exclusions: Tenants' and seller's personal property.
- The owner pays for water
- Assessor Parcel Number 2430819000
Map
Home Values in the Area
Average Home Value in this Area
Tax History
| Year | Tax Paid | Tax Assessment Tax Assessment Total Assessment is a certain percentage of the fair market value that is determined by local assessors to be the total taxable value of land and additions on the property. | Land | Improvement |
|---|---|---|---|---|
| 2024 | $3,145 | $141,000 | $3,900 | $137,100 |
| 2023 | $2,368 | $100,200 | $3,900 | $96,300 |
| 2022 | $2,312 | $100,200 | $3,900 | $96,300 |
| 2021 | $2,627 | $95,900 | $3,900 | $92,000 |
| 2020 | $2,573 | $95,900 | $3,900 | $92,000 |
| 2019 | $1,879 | $67,900 | $4,000 | $63,900 |
| 2018 | $1,690 | $67,900 | $4,000 | $63,900 |
| 2017 | $1,772 | $67,600 | $4,800 | $62,800 |
| 2016 | $0 | $70,100 | $4,800 | $65,300 |
| 2015 | -- | $70,100 | $4,800 | $65,300 |
| 2014 | -- | $70,100 | $4,800 | $65,300 |
| 2013 | -- | $79,600 | $4,800 | $74,800 |
Property History
| Date | Event | Price | List to Sale | Price per Sq Ft |
|---|---|---|---|---|
| 12/04/2025 12/04/25 | Price Changed | $179,900 | -2.8% | $104 / Sq Ft |
| 11/06/2025 11/06/25 | Price Changed | $185,000 | -2.6% | $107 / Sq Ft |
| 10/04/2025 10/04/25 | For Sale | $189,900 | -- | $110 / Sq Ft |
Purchase History
| Date | Type | Sale Price | Title Company |
|---|---|---|---|
| Quit Claim Deed | -- | None Listed On Document | |
| Warranty Deed | $76,500 | None Available | |
| Quit Claim Deed | -- | Attorney |
Mortgage History
| Date | Status | Loan Amount | Loan Type |
|---|---|---|---|
| Open | $85,500 | New Conventional | |
| Previous Owner | $49,900 | Adjustable Rate Mortgage/ARM | |
| Previous Owner | $21,250 | Adjustable Rate Mortgage/ARM |
Source: Metro MLS
MLS Number: 1937979
APN: 243-0819-000-1
Disclaimer: Certain information contained herein is derived from information provided by parties other than Homes.com. All information provided is deemed reliable, but is not guaranteed to be accurate and should be independently verified.
![]() IDX information is provided exclusively for personal, non-commercial use, and may not be used for any purpose other than to identify prospective properties consumers may be interested in purchasing.
IDX information is provided exclusively for personal, non-commercial use, and may not be used for any purpose other than to identify prospective properties consumers may be interested in purchasing.
IDX listing data provided by Multiple Listing Service, Inc. Information is supplied by seller and other third parties and has not been verified.
Copyright 2025 – Multiple Listing Service, Inc. – All Rights Reserved.
- 4182 N 13th St
- 1229 W Olive St
- 4317 N Green Bay Ave
- 4143 N 10th St
- 4166 N 17th St
- 4048 N 17th St Unit 4050
- 3941 N 12th St
- 4118 N 7th St
- 4110 N 7th St
- 4102 N 7th St
- 4223 N 18th St
- 4249 N 18th St
- 3906 N 14th St
- 3848 N 10th St
- 4024 N 19th St
- 4050 N 6th St
- 4047 N 19th St Unit 4049
- 1932 W Capitol Dr
- 3746 N 11th St
- 1917 W Atkinson Ave
- 4738 N 20th St
- 1802 W Keefe Ave
- 500 W Hampton Ave
- 3429 N 20th St
- 4848 N Lydell Ave
- 4370 N 28th St Unit Upper
- 100-246 E Chateau Place
- 1981 W Villard Ave Unit 7
- 3352 N Richards St
- 4544 N Wilson Dr
- 3921 N Humboldt Blvd
- 4918 N Berkeley Blvd
- 3242 N Achilles St Unit 3242 N Achillies St
- 4305 N Marlborough Dr
- 3315 N Holton St
- 3210 N Richards St Unit 3210
- 3326 N 29th St Unit 3326 N 29th st. LOWER
- 1705 W Custer Ave
- 1400 W Custer Ave
- 3225 N 27th St