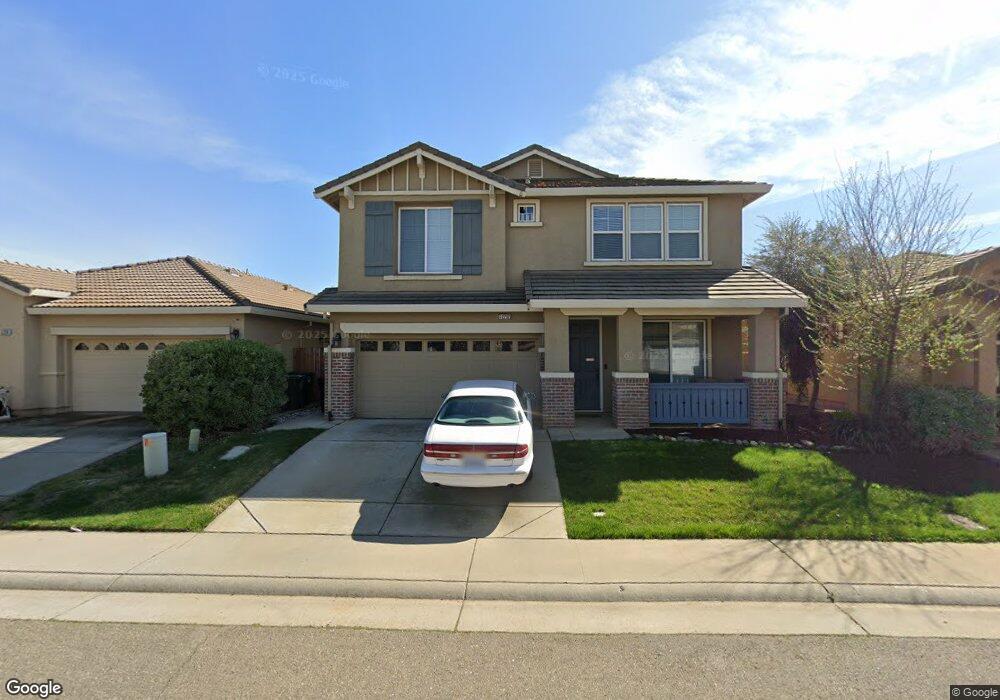
12232 Habitat Way Unit Lot08 Rancho Cordova, CA 95742
Sunridge Park NeighborhoodEstimated Value: $599,000 - $737,000
3
Beds
2
Baths
2,081
Sq Ft
$313/Sq Ft
Est. Value
About This Home
This home is located at 12232 Habitat Way Unit Lot08, Rancho Cordova, CA 95742 and is currently estimated at $650,946, approximately $312 per square foot. 12232 Habitat Way Unit Lot08 is a home located in Sacramento County with nearby schools including Sunrise Elementary School, Katherine L. Albiani Middle School, and Pleasant Grove High School.
Ownership History
Date
Name
Owned For
Owner Type
Purchase Details
Closed on
Jul 7, 2017
Sold by
Jenkins Scott and Jenkins Kari
Bought by
Reddy Jangiti Shruthi and Reddy Chada Vamshi Krishna
Current Estimated Value
Home Financials for this Owner
Home Financials are based on the most recent Mortgage that was taken out on this home.
Original Mortgage
$410,052
Outstanding Balance
$341,151
Interest Rate
3.94%
Mortgage Type
FHA
Estimated Equity
$309,795
Purchase Details
Closed on
Oct 17, 2008
Sold by
Woodside O5n Lp
Bought by
Jenkins Scott and Jenkins Kari
Home Financials for this Owner
Home Financials are based on the most recent Mortgage that was taken out on this home.
Original Mortgage
$312,054
Interest Rate
5.77%
Mortgage Type
FHA
Create a Home Valuation Report for This Property
The Home Valuation Report is an in-depth analysis detailing your home's value as well as a comparison with similar homes in the area
Home Values in the Area
Average Home Value in this Area
Purchase History
| Date | Buyer | Sale Price | Title Company |
|---|---|---|---|
| Reddy Jangiti Shruthi | $418,000 | Chicago Title Company | |
| Jenkins Scott | $317,500 | Placer Title Company |
Source: Public Records
Mortgage History
| Date | Status | Borrower | Loan Amount |
|---|---|---|---|
| Open | Reddy Jangiti Shruthi | $410,052 | |
| Previous Owner | Jenkins Scott | $312,054 |
Source: Public Records
Tax History Compared to Growth
Tax History
| Year | Tax Paid | Tax Assessment Tax Assessment Total Assessment is a certain percentage of the fair market value that is determined by local assessors to be the total taxable value of land and additions on the property. | Land | Improvement |
|---|---|---|---|---|
| 2025 | $9,394 | $705,702 | $196,323 | $509,379 |
| 2024 | $9,394 | $691,866 | $192,474 | $499,392 |
| 2023 | $9,171 | $678,300 | $188,700 | $489,600 |
| 2022 | $6,747 | $448,178 | $123,302 | $324,876 |
| 2021 | $6,632 | $439,391 | $120,885 | $318,506 |
| 2020 | $6,550 | $434,887 | $119,646 | $315,241 |
| 2019 | $6,442 | $426,360 | $117,300 | $309,060 |
| 2018 | $6,907 | $418,000 | $115,000 | $303,000 |
| 2017 | $6,164 | $351,999 | $133,145 | $218,854 |
| 2016 | $5,912 | $345,098 | $130,535 | $214,563 |
| 2015 | $5,794 | $339,916 | $128,575 | $211,341 |
| 2014 | $5,687 | $333,259 | $126,057 | $207,202 |
Source: Public Records
Map
Nearby Homes
- 4056 Branigan Lake Way
- Plan 3 at Bloom at Sunridge Park
- Plan 1 at Bloom at Sunridge Park
- Plan 2 at Bloom at Sunridge Park
- 12260 Habitat Way
- 3952 Aura Way
- 3950 Aura Way
- 3960 Aura Way
- 4074 Timberland Dr
- 12217 Hetch Hechy Dr
- 12233 Hetch Hechy Dr
- 12213 Hetch Hechy Dr
- 12205 Hetch Hechy Dr
- 12306 Canyonlands Dr
- 12327 El Portal Way
- 4128 Pingree Lake Way
- 12137 Wistar Way
- 4040 Aura Way
- 12337 Tawana Dome Way
- 4131 Aura Way
- 12232 Habitat Way
- 12236 Habitat Way
- 12228 Habitat Way
- 12240 Habitat Way
- 12224 Habitat Way
- 12233 Canyonlands Dr Unit Lot16
- 12233 Canyonlands Dr
- 12237 Canyonlands Dr
- 12229 Canyonlands Dr
- 12244 Habitat Way Unit Lot05
- 12244 Habitat Way
- 12233 Habitat Way
- 12241 Canyonlands Dr Unit Lot18
- 12241 Canyonlands Dr
- 12225 Canyonlands Dr
- 12220 Habitat Way
- 12237 Habitat Way
- 12229 Habitat Way
- 12241 Habitat Way Unit 1
- 12241 Habitat Way