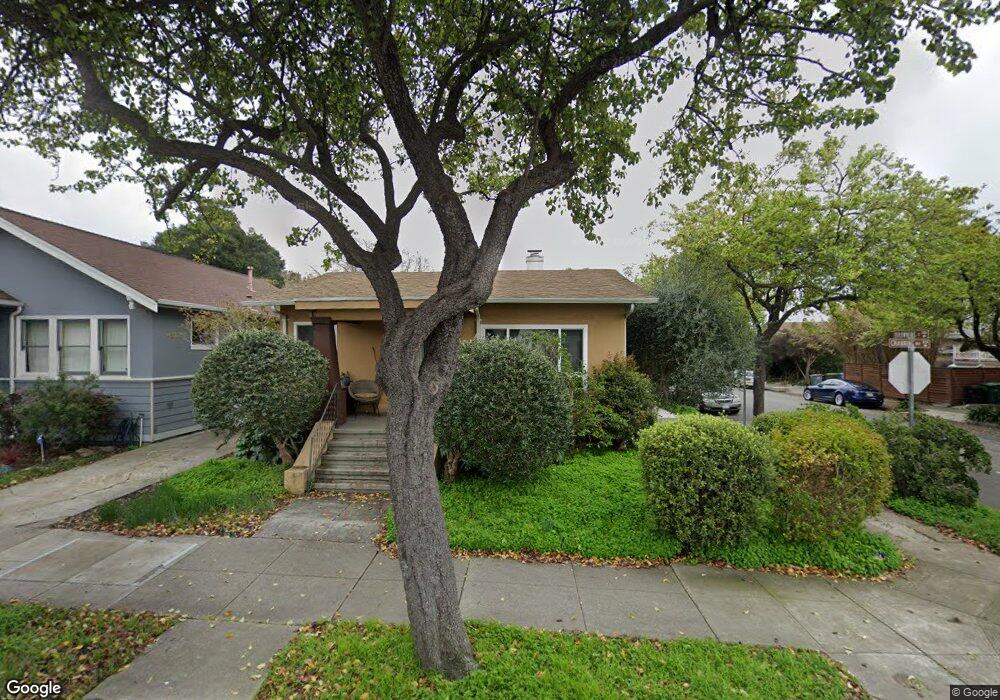
1224 Channing Way Berkeley, CA 94702
West Berkeley NeighborhoodEstimated Value: $1,169,000 - $1,521,000
2
Beds
1
Bath
1,456
Sq Ft
$886/Sq Ft
Est. Value
About This Home
This home is located at 1224 Channing Way, Berkeley, CA 94702 and is currently estimated at $1,289,859, approximately $885 per square foot. 1224 Channing Way is a home located in Alameda County with nearby schools including Rosa Parks Elementary School, Ruth Acty Elementary, and Berkeley Arts Magnet at Whittier School.
Ownership History
Date
Name
Owned For
Owner Type
Purchase Details
Closed on
Nov 14, 2007
Sold by
Patterson Chet and Castner Christine
Bought by
Nauman Christopher and Nauman Suzanne
Current Estimated Value
Home Financials for this Owner
Home Financials are based on the most recent Mortgage that was taken out on this home.
Original Mortgage
$275,000
Outstanding Balance
$173,815
Interest Rate
6.36%
Mortgage Type
Purchase Money Mortgage
Estimated Equity
$1,116,044
Purchase Details
Closed on
May 26, 2005
Sold by
Adams Altamae B and Boutte Kenneth
Bought by
Patterson Chet and Castner Christine
Home Financials for this Owner
Home Financials are based on the most recent Mortgage that was taken out on this home.
Original Mortgage
$500,000
Interest Rate
5.62%
Mortgage Type
Purchase Money Mortgage
Purchase Details
Closed on
Oct 13, 2004
Sold by
Adams Altamae B
Bought by
Adams Altamae B
Purchase Details
Closed on
Aug 24, 2002
Sold by
Boutte Hazel
Bought by
Boutte Hazel and Adams Altamae P
Create a Home Valuation Report for This Property
The Home Valuation Report is an in-depth analysis detailing your home's value as well as a comparison with similar homes in the area
Home Values in the Area
Average Home Value in this Area
Purchase History
| Date | Buyer | Sale Price | Title Company |
|---|---|---|---|
| Nauman Christopher | $614,000 | Chicago Title Company | |
| Patterson Chet | $575,000 | Chicago Title Co | |
| Adams Altamae B | -- | -- | |
| Boutte Hazel | -- | -- |
Source: Public Records
Mortgage History
| Date | Status | Borrower | Loan Amount |
|---|---|---|---|
| Open | Nauman Christopher | $275,000 | |
| Previous Owner | Patterson Chet | $500,000 | |
| Closed | Patterson Chet | $75,000 |
Source: Public Records
Tax History
| Year | Tax Paid | Tax Assessment Tax Assessment Total Assessment is a certain percentage of the fair market value that is determined by local assessors to be the total taxable value of land and additions on the property. | Land | Improvement |
|---|---|---|---|---|
| 2025 | $11,941 | $806,445 | $241,933 | $564,512 |
| 2024 | $11,941 | $790,634 | $237,190 | $553,444 |
| 2023 | $11,698 | $775,137 | $232,541 | $542,596 |
| 2022 | $11,501 | $759,941 | $227,982 | $531,959 |
| 2021 | $11,535 | $745,045 | $223,513 | $521,532 |
| 2020 | $10,952 | $737,407 | $221,222 | $516,185 |
| 2019 | $10,559 | $722,954 | $216,886 | $506,068 |
| 2018 | $10,390 | $708,782 | $212,634 | $496,148 |
| 2017 | $10,022 | $694,887 | $208,466 | $486,421 |
| 2016 | $9,725 | $681,263 | $204,379 | $476,884 |
| 2015 | $9,601 | $671,034 | $201,310 | $469,724 |
| 2014 | $9,545 | $657,894 | $197,368 | $460,526 |
Source: Public Records
Map
Nearby Homes
- 2435 Bonar St
- 2324 Browning St
- 1118 Dwight Way
- 2437 Acton St
- 1431 Dwight Way
- 2231 Byron St
- 1135 Parker St
- 1039 Channing Way
- 2423 10th St
- 2304 Edwards St
- 2350 Sacramento St
- 1516 Blake St
- 1516 Blake St Unit A
- 2717 Mabel St
- 1524 Blake St
- 917 Channing Way
- 1604 Dwight Way
- 1515 Derby St
- 2411 Sixth St
- 2238 7th St
- 1226 Channing Way
- 1228 Channing Way
- 2409 Browning St
- 1220 Channing Way
- 1232 Channing Way
- 2413 Browning St
- 1216 Channing Way
- 1236 Channing Way
- 2408 Browning St
- 1225 Channing Way
- 1227 Channing Way
- 2417 Browning St
- 2410 Browning St
- 1231 Channing Way
- 1229 Channing Way
- 1212 Channing Way
- 2402 Bonar St
- 2414 Browning St
- 2416 Bonar St
- 2348 Browning St