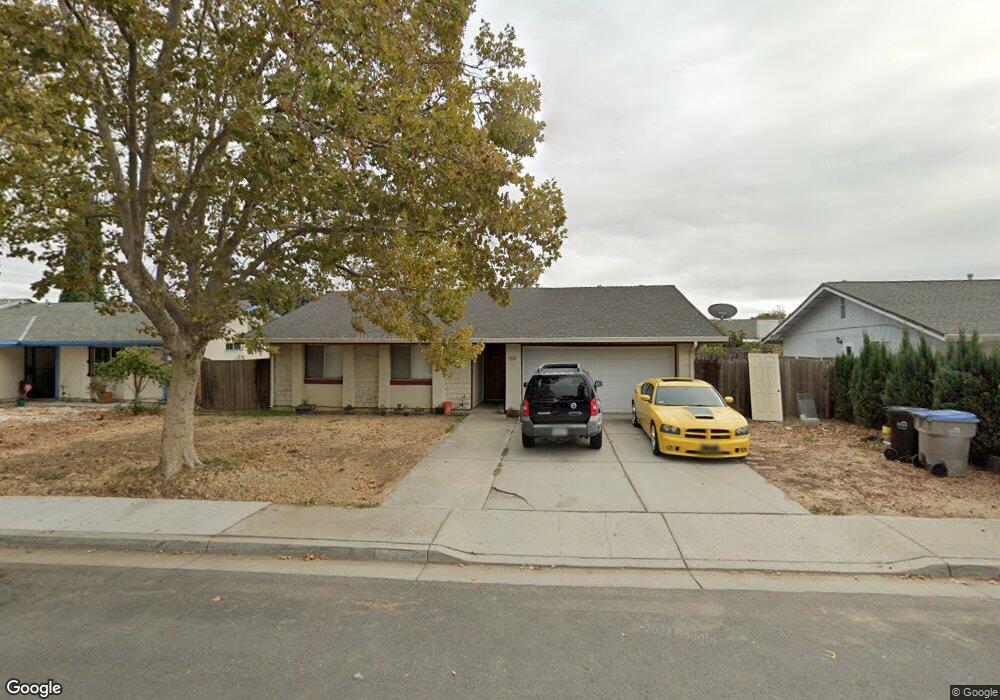
1224 Danforth Ct San Jose, CA 95121
Stonegate NeighborhoodEstimated Value: $973,287 - $1,162,000
3
Beds
2
Baths
1,489
Sq Ft
$721/Sq Ft
Est. Value
About This Home
This home is located at 1224 Danforth Ct, San Jose, CA 95121 and is currently estimated at $1,073,322, approximately $720 per square foot. 1224 Danforth Ct is a home located in Santa Clara County with nearby schools including Windmill Springs Elementary School, Sylvandale Middle School, and Yerba Buena High School.
Ownership History
Date
Name
Owned For
Owner Type
Purchase Details
Closed on
Dec 21, 2022
Sold by
Truong Nelson N and Truong Thuy Thu
Bought by
Nelson Truong And Thuy Huynh Living Trust
Current Estimated Value
Purchase Details
Closed on
Apr 8, 2019
Sold by
Truong Nelson N
Bought by
Truong Nelson N and Huynh Thu Thi
Purchase Details
Closed on
Apr 6, 2005
Sold by
Truong Nelson Nhan
Bought by
Truong Nelson Nhan
Purchase Details
Closed on
Sep 4, 2000
Sold by
Truong Nelson N
Bought by
Nelson Nhan Truong Living Trust
Purchase Details
Closed on
Dec 30, 1996
Sold by
Panganiban Eufronio A and Panganiban Zenaida C
Bought by
Truong Nelson Nhan
Home Financials for this Owner
Home Financials are based on the most recent Mortgage that was taken out on this home.
Original Mortgage
$145,600
Interest Rate
7.53%
Create a Home Valuation Report for This Property
The Home Valuation Report is an in-depth analysis detailing your home's value as well as a comparison with similar homes in the area
Home Values in the Area
Average Home Value in this Area
Purchase History
| Date | Buyer | Sale Price | Title Company |
|---|---|---|---|
| Nelson Truong And Thuy Huynh Living Trust | -- | -- | |
| Truong Nelson N | -- | None Available | |
| Truong Nelson Nhan | -- | Alliance Title Company | |
| Nelson Nhan Truong Living Trust | -- | -- | |
| Truong Nelson Nhan | $182,000 | North American Title Co |
Source: Public Records
Mortgage History
| Date | Status | Borrower | Loan Amount |
|---|---|---|---|
| Previous Owner | Truong Nelson Nhan | $145,600 |
Source: Public Records
Tax History
| Year | Tax Paid | Tax Assessment Tax Assessment Total Assessment is a certain percentage of the fair market value that is determined by local assessors to be the total taxable value of land and additions on the property. | Land | Improvement |
|---|---|---|---|---|
| 2025 | $5,995 | $296,396 | $162,856 | $133,540 |
| 2024 | $5,995 | $290,585 | $159,663 | $130,922 |
| 2023 | $5,873 | $284,888 | $156,533 | $128,355 |
| 2022 | $5,742 | $279,303 | $153,464 | $125,839 |
| 2021 | $5,080 | $273,827 | $150,455 | $123,372 |
| 2020 | $4,858 | $271,020 | $148,913 | $122,107 |
| 2019 | $4,659 | $265,707 | $145,994 | $119,713 |
| 2018 | $4,636 | $260,498 | $143,132 | $117,366 |
| 2017 | $4,571 | $255,391 | $140,326 | $115,065 |
| 2016 | $4,348 | $250,384 | $137,575 | $112,809 |
| 2015 | $4,258 | $246,624 | $135,509 | $111,115 |
| 2014 | $3,813 | $241,794 | $132,855 | $108,939 |
Source: Public Records
Map
Nearby Homes
- 2372 Balme Dr
- 2252 Denair Ave
- 1371 Sunnycrest Cir
- 2690 Mclaughlin Ave
- 1314 Pellier Ct
- 2315 Warfield Way Unit B
- 2582 Tosca Way
- 2197 Summerton Dr
- 2698 Kendrick Cir
- 2175 Summerton Dr
- 2269 Warfield Way Unit A
- 1042 Summermist Ct Unit 107
- 1050 Summermist Ct
- 2606 Apollo Dr
- 1050 Summershore Ct
- 1045 Summershore Ct
- 2739 Mclaughlin Ave
- 1079 Drexel Way
- 2019 Malden Ave
- 1262 Turtlerock Dr
- 1214 Danforth Ct
- 1238 Danforth Ct
- 1221 Zachary Ct
- 1235 Zachary Ct
- 1211 Zachary Ct
- 1252 Danforth Ct
- 1225 Danforth Ct
- 1249 Zachary Ct
- 1215 Danforth Ct
- 1239 Danforth Ct
- 1260 Danforth Ct
- 1253 Danforth Ct
- 1261 Zachary Ct
- 1220 Zachary Ct
- 1236 Zachary Ct
- 1261 Danforth Ct
- 1210 Zachary Ct
- 1276 Danforth Ct
- 1250 Zachary Ct
- 1275 Zachary Ct
Your Personal Tour Guide
Ask me questions while you tour the home.