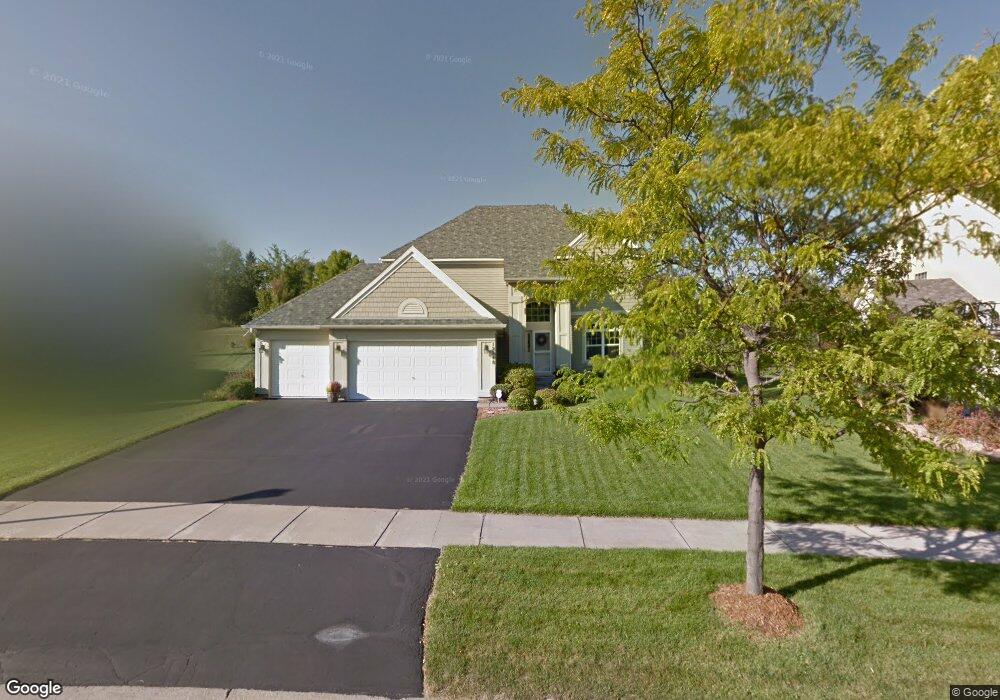
12248 86th Ave N Maple Grove, MN 55369
Estimated Value: $558,729 - $685,000
5
Beds
4
Baths
2,449
Sq Ft
$249/Sq Ft
Est. Value
About This Home
This home is located at 12248 86th Ave N, Maple Grove, MN 55369 and is currently estimated at $608,682, approximately $248 per square foot. 12248 86th Ave N is a home located in Hennepin County with nearby schools including Rice Lake Elementary School, Maple Grove Middle School, and Maple Grove Senior High School.
Ownership History
Date
Name
Owned For
Owner Type
Purchase Details
Closed on
Jun 15, 2010
Sold by
Zauhar Luke T and Zauhar Rawney
Bought by
Schultz Daren J and Schultz Tarrah A
Current Estimated Value
Purchase Details
Closed on
Jun 13, 2008
Sold by
Albet Joshua S and Albert Amy M
Bought by
Zauhar Luke T
Purchase Details
Closed on
Mar 23, 2001
Sold by
Tradition Development Llc
Bought by
The Rottlund Company Inc
Purchase Details
Closed on
May 31, 2000
Sold by
The Rottlund Company Inc
Bought by
Tradition Development Llc
Create a Home Valuation Report for This Property
The Home Valuation Report is an in-depth analysis detailing your home's value as well as a comparison with similar homes in the area
Home Values in the Area
Average Home Value in this Area
Purchase History
| Date | Buyer | Sale Price | Title Company |
|---|---|---|---|
| Schultz Daren J | $361,250 | -- | |
| Zauhar Luke T | $395,000 | -- | |
| The Rottlund Company Inc | $23,400 | -- | |
| Albert Joshua S | $287,380 | -- | |
| Tradition Development Llc | $2,655,118 | -- |
Source: Public Records
Tax History Compared to Growth
Tax History
| Year | Tax Paid | Tax Assessment Tax Assessment Total Assessment is a certain percentage of the fair market value that is determined by local assessors to be the total taxable value of land and additions on the property. | Land | Improvement |
|---|---|---|---|---|
| 2024 | $6,271 | $512,100 | $131,200 | $380,900 |
| 2023 | $6,185 | $522,400 | $148,600 | $373,800 |
| 2022 | $5,201 | $509,000 | $127,200 | $381,800 |
| 2021 | $5,021 | $427,700 | $105,400 | $322,300 |
| 2020 | $4,999 | $404,900 | $90,700 | $314,200 |
| 2019 | $5,301 | $386,600 | $81,200 | $305,400 |
| 2018 | $5,078 | $386,800 | $99,900 | $286,900 |
| 2017 | $5,253 | $362,700 | $96,000 | $266,700 |
| 2016 | $5,195 | $354,000 | $96,000 | $258,000 |
| 2015 | $5,152 | $342,200 | $87,000 | $255,200 |
| 2014 | -- | $319,600 | $89,900 | $229,700 |
Source: Public Records
Map
Nearby Homes
- 12509 88th Ave N
- 11879 85th Place N Unit 54
- 12598 84th Place N
- 11760 88th Place N
- 8405 Norwood Ln N
- 11631 88th Ave N
- 8406 Jonquil Ln N
- 11537 88th Ave N
- 8326 Oakview Ct N
- 8704 Cottonwood Ln N
- 9058 Goldenrod Ln N
- 8949 Rosewood Ln N
- 9132 Kirkwood Ln N
- 12775 82nd Place N
- 11601 82nd Ave N
- 11540 81st Place N
- 11462 81st Place N
- 13152 90th Place N
- 9061 Underwood Ln N
- 13611 86th Ave N
- 12248 12248 86th-Avenue-n
- 12270 86th Ave N
- 12216 86th Ave N
- 12194 86th Ave N
- 12233 86th Ave N
- 12265 86th Ave N
- 12265 12265 86th-Avenue-n
- 12271 87th Ave N
- 12287 86th Ave N
- 12201 86th Ave N
- 12249 87th Ave N
- 12330 86th Ave N
- 12352 86th Ave N
- 12142 86th Ave N
- 12319 87th Ave N
- 12227 87th Ave N
- 12341 87th Ave N
- 8598 Magnolia Ln
- 12129 86th Ave N
- 12364 86th Ave N