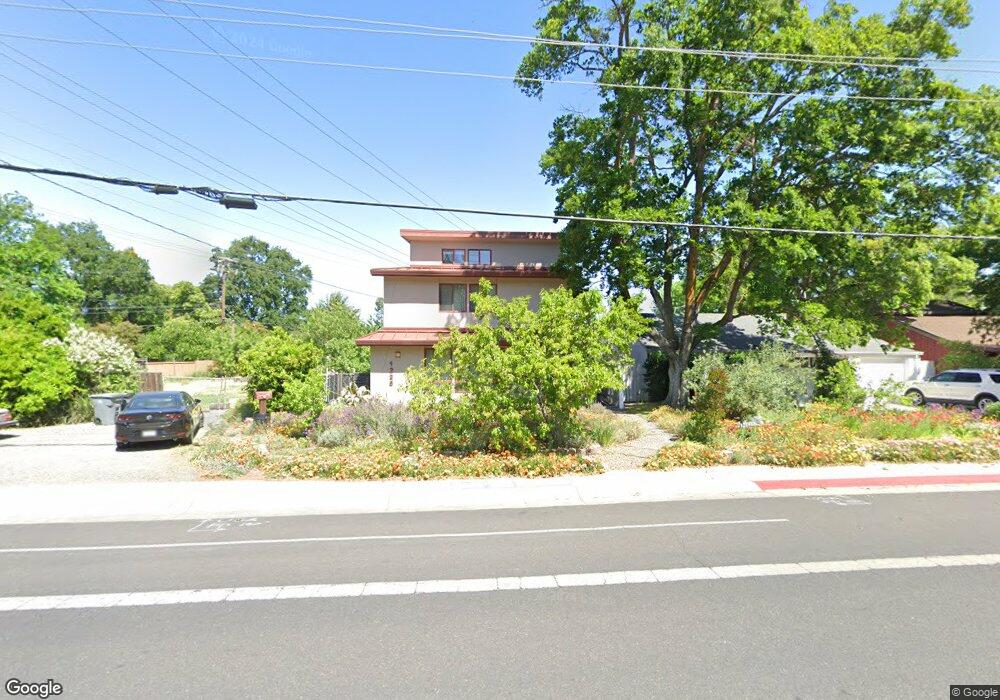
1225 E 8th St Davis, CA 95616
Central Davis NeighborhoodEstimated Value: $674,357 - $795,000
2
Beds
2
Baths
1,405
Sq Ft
$537/Sq Ft
Est. Value
About This Home
This home is located at 1225 E 8th St, Davis, CA 95616 and is currently estimated at $754,589, approximately $537 per square foot. 1225 E 8th St is a home located in Yolo County with nearby schools including North Davis Elementary School, Oliver Wendell Holmes Junior High School, and Davis Senior High School.
Ownership History
Date
Name
Owned For
Owner Type
Purchase Details
Closed on
Aug 29, 2022
Sold by
The Braily Family August and Braly Pussadee Bhumiratana
Bought by
The Braily Family Trust and Braly
Current Estimated Value
Purchase Details
Closed on
Mar 22, 2000
Sold by
Dougherty Bonnie J Tr
Bought by
Braly Bruce J and Braly Pussadee Bhumiratana
Purchase Details
Closed on
Jan 16, 1996
Sold by
Dougherty Bonnie J
Bought by
Dougherty Bonnie J and Dougherty Robert A
Create a Home Valuation Report for This Property
The Home Valuation Report is an in-depth analysis detailing your home's value as well as a comparison with similar homes in the area
Home Values in the Area
Average Home Value in this Area
Purchase History
| Date | Buyer | Sale Price | Title Company |
|---|---|---|---|
| The Braily Family Trust | -- | None Listed On Document | |
| Braly Bruce J | $60,000 | Placer Title Company | |
| Dougherty Bonnie J | -- | -- |
Source: Public Records
Tax History
| Year | Tax Paid | Tax Assessment Tax Assessment Total Assessment is a certain percentage of the fair market value that is determined by local assessors to be the total taxable value of land and additions on the property. | Land | Improvement |
|---|---|---|---|---|
| 2025 | $5,663 | $389,590 | $76,838 | $312,752 |
| 2023 | $5,663 | $374,463 | $73,855 | $300,608 |
| 2022 | $5,417 | $367,121 | $72,407 | $294,714 |
| 2021 | $5,281 | $359,924 | $70,988 | $288,936 |
| 2020 | $5,193 | $356,235 | $70,261 | $285,974 |
| 2019 | $4,907 | $349,251 | $68,884 | $280,367 |
| 2018 | $4,582 | $342,404 | $67,534 | $274,870 |
| 2017 | $4,483 | $335,691 | $66,210 | $269,481 |
| 2016 | $4,325 | $329,110 | $64,912 | $264,198 |
| 2015 | $4,179 | $324,167 | $63,937 | $260,230 |
| 2014 | $4,179 | $317,818 | $62,685 | $255,133 |
Source: Public Records
Map
Nearby Homes
Your Personal Tour Guide
Ask me questions while you tour the home.