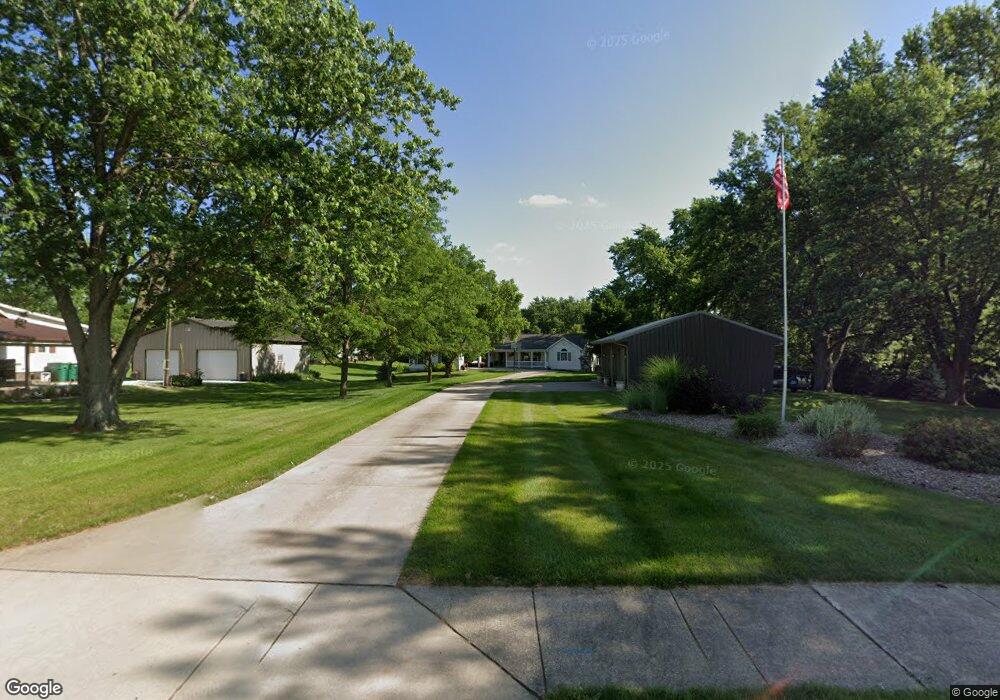
1225 W Grant St Macomb, IL 61455
Estimated Value: $156,000 - $313,157
3
Beds
--
Bath
2,100
Sq Ft
$110/Sq Ft
Est. Value
About This Home
This home is located at 1225 W Grant St, Macomb, IL 61455 and is currently estimated at $230,289, approximately $109 per square foot. 1225 W Grant St is a home located in McDonough County with nearby schools including Edison Elementary School, Lincoln Elementary School, and Macomb Junior High School.
Ownership History
Date
Name
Owned For
Owner Type
Purchase Details
Closed on
Mar 4, 2025
Sold by
Ingledue Beau J and Ingledue Christa L
Bought by
Christa L Ingledue Trust and Ingledue
Current Estimated Value
Purchase Details
Closed on
Apr 3, 2009
Sold by
Turner Gregory W and Turner Tammy S
Bought by
Ingledue Beau J and Ingledue Christa L
Home Financials for this Owner
Home Financials are based on the most recent Mortgage that was taken out on this home.
Original Mortgage
$180,000
Interest Rate
5.19%
Mortgage Type
New Conventional
Create a Home Valuation Report for This Property
The Home Valuation Report is an in-depth analysis detailing your home's value as well as a comparison with similar homes in the area
Home Values in the Area
Average Home Value in this Area
Purchase History
| Date | Buyer | Sale Price | Title Company |
|---|---|---|---|
| Christa L Ingledue Trust | -- | None Listed On Document | |
| Ingledue Beau J | $2,350 | None Available |
Source: Public Records
Mortgage History
| Date | Status | Borrower | Loan Amount |
|---|---|---|---|
| Previous Owner | Ingledue Beau J | $180,000 |
Source: Public Records
Tax History
| Year | Tax Paid | Tax Assessment Tax Assessment Total Assessment is a certain percentage of the fair market value that is determined by local assessors to be the total taxable value of land and additions on the property. | Land | Improvement |
|---|---|---|---|---|
| 2024 | $9,120 | $85,264 | $7,238 | $78,026 |
| 2023 | $9,321 | $81,718 | $6,937 | $74,781 |
| 2022 | $8,647 | $79,176 | $6,721 | $72,455 |
| 2021 | $8,297 | $79,176 | $6,721 | $72,455 |
| 2020 | $8,193 | $85,692 | $6,705 | $78,987 |
| 2019 | $8,186 | $81,170 | $6,890 | $74,280 |
| 2018 | $7,703 | $81,170 | $6,890 | $74,280 |
| 2017 | $8,727 | $92,998 | $14,371 | $78,627 |
| 2016 | $8,374 | $92,014 | $14,219 | $77,795 |
| 2015 | $8,228 | $89,910 | $13,894 | $76,016 |
| 2014 | $7,523 | $87,466 | $13,686 | $73,780 |
| 2013 | $7,894 | $87,466 | $13,686 | $73,780 |
Source: Public Records
Map
Nearby Homes
- 1112 Stacy Ln
- 820 W Mcdonough St
- 131 W Barsi Blvd
- 407 S Ward St
- 101 W Barsi Blvd
- 702 & 708 W Piper St
- 329 W Fisk St
- 2001 W Jackson St Unit C
- 239 W Fisk St
- 236 W Fisk St
- 336 W Woodbury St
- 828 S Mcarthur St
- 214 W Mcdonough St
- 521 S Johnson St
- 408 S Johnson St
- 209 N Ward St
- 305 N Ward St
- 421 S Mcarthur St
- 713 W Calhoun St
- 648 S Randolph St
Your Personal Tour Guide
Ask me questions while you tour the home.