Estimated Value: $219,984 - $263,000
3
Beds
1
Bath
1,086
Sq Ft
$224/Sq Ft
Est. Value
About This Home
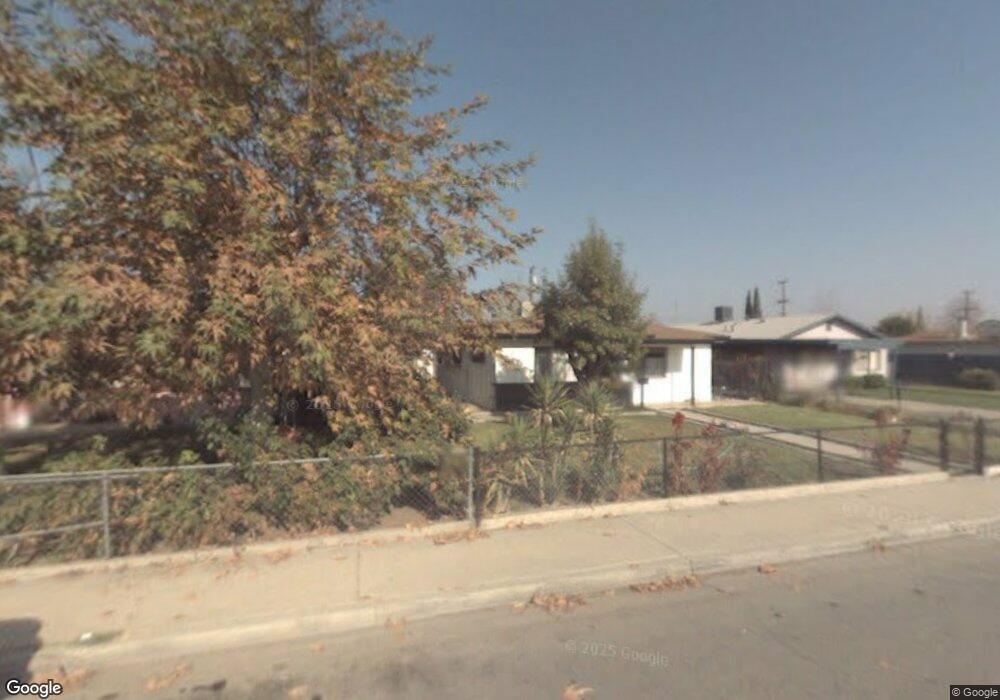
This home is located at 1226 13th St, Wasco, CA 93280 and is currently estimated at $243,496, approximately $224 per square foot. 1226 13th St is a home located in Kern County with nearby schools including Palm Avenue Elementary School, Thomas Jefferson Middle School, and Wasco High School.
Ownership History
Date
Name
Owned For
Owner Type
Purchase Details
Closed on
Feb 22, 2018
Sold by
Lopez Odilia M and The Odilia M Lopez Living Trus
Bought by
Baly Rosa Elisa and The Odilia M Lopez Grantor Tru
Current Estimated Value
Purchase Details
Closed on
Oct 4, 2013
Sold by
Lopez Odilia M
Bought by
Lopez Odilia M and Odilia M Lopez Living Trust
Purchase Details
Closed on
Sep 26, 2001
Sold by
Lopez Odilia M
Bought by
Lopez Odilia M
Home Financials for this Owner
Home Financials are based on the most recent Mortgage that was taken out on this home.
Original Mortgage
$15,000
Interest Rate
6.91%
Create a Home Valuation Report for This Property
The Home Valuation Report is an in-depth analysis detailing your home's value as well as a comparison with similar homes in the area
Home Values in the Area
Average Home Value in this Area
Purchase History
| Date | Buyer | Sale Price | Title Company |
|---|---|---|---|
| Baly Rosa Elisa | -- | None Available | |
| Lopez Odilia M | -- | None Available | |
| Lopez Odilia M | -- | First American Title Ins Co |
Source: Public Records
Mortgage History
| Date | Status | Borrower | Loan Amount |
|---|---|---|---|
| Closed | Lopez Odilia M | $15,000 |
Source: Public Records
Tax History
| Year | Tax Paid | Tax Assessment Tax Assessment Total Assessment is a certain percentage of the fair market value that is determined by local assessors to be the total taxable value of land and additions on the property. | Land | Improvement |
|---|---|---|---|---|
| 2025 | $601 | $28,611 | $5,397 | $23,214 |
| 2024 | $584 | $28,051 | $5,292 | $22,759 |
| 2023 | $584 | $27,502 | $5,189 | $22,313 |
| 2022 | $536 | $26,964 | $5,088 | $21,876 |
| 2021 | $490 | $26,437 | $4,989 | $21,448 |
| 2020 | $449 | $26,167 | $4,938 | $21,229 |
| 2019 | $447 | $26,167 | $4,938 | $21,229 |
| 2018 | $446 | $25,153 | $4,748 | $20,405 |
| 2017 | $436 | $24,660 | $4,655 | $20,005 |
| 2016 | $408 | $24,177 | $4,564 | $19,613 |
| 2015 | $386 | $23,815 | $4,496 | $19,319 |
| 2014 | $373 | $23,349 | $4,408 | $18,941 |
Source: Public Records
Map
Nearby Homes
- 1218 13th St
- 1245 Poso Dr
- 0 Pine St
- 1533 Pine St
- 1073 12th St
- 1245 Broadway St
- 1015 16th St
- 1034 Oak Ave
- 1858 Broadway St
- 0 Laredo St Unit 202601461
- 0 Laredo St Unit 202601460
- 0 Laredo St Unit 202508732
- 0 Laredo St Unit 202508731
- 1526 D St
- 1957 Greenbrier Ct
- 1954 Broadway St
- 916 Oak Ave
- 1425 G St
- 1011 G St
- 1205 7th Place
Your Personal Tour Guide
Ask me questions while you tour the home.