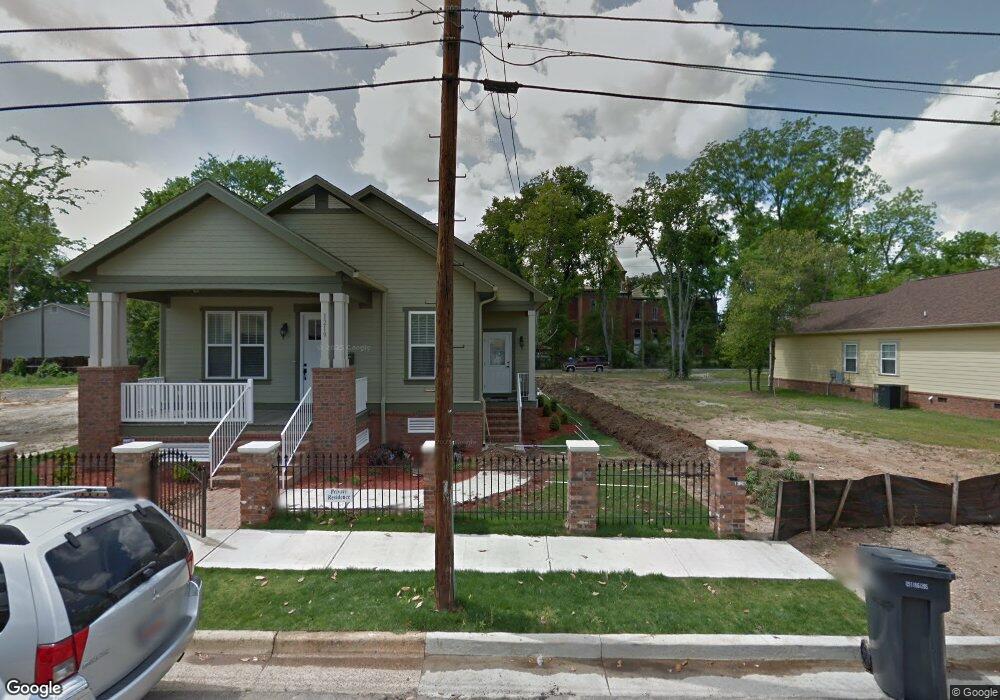
1227 Pine St Augusta, GA 30901
Laney Walker NeighborhoodEstimated Value: $195,094 - $266,000
3
Beds
2
Baths
1,422
Sq Ft
$156/Sq Ft
Est. Value
About This Home
This home is located at 1227 Pine St, Augusta, GA 30901 and is currently estimated at $222,524, approximately $156 per square foot. 1227 Pine St is a home located in Richmond County with nearby schools including W.S. Hornsby School, W.S. Hornsby Elementary School, and Johnson Magnet.
Ownership History
Date
Name
Owned For
Owner Type
Purchase Details
Closed on
Dec 22, 2011
Sold by
Augusta Georgia Land Bank Auth
Bought by
Boyd Chawnette L
Current Estimated Value
Home Financials for this Owner
Home Financials are based on the most recent Mortgage that was taken out on this home.
Original Mortgage
$96,416
Outstanding Balance
$63,904
Interest Rate
3.75%
Mortgage Type
FHA
Estimated Equity
$158,620
Purchase Details
Closed on
Aug 31, 2011
Sold by
Augusta Georgia Land Bank
Bought by
Green Frank
Purchase Details
Closed on
May 25, 2010
Sold by
C B Walker Contractor Inc
Bought by
Augusta Georgia Land Bank Authority
Purchase Details
Closed on
Aug 24, 2009
Sold by
Vision Development Associates
Bought by
C B Walker Contractor Inc
Purchase Details
Closed on
Dec 20, 2007
Sold by
Walker Calvin B
Bought by
Vision Development Associates Llc
Purchase Details
Closed on
Nov 5, 2007
Sold by
Hart Alton
Bought by
Walker Calvin B
Create a Home Valuation Report for This Property
The Home Valuation Report is an in-depth analysis detailing your home's value as well as a comparison with similar homes in the area
Home Values in the Area
Average Home Value in this Area
Purchase History
| Date | Buyer | Sale Price | Title Company |
|---|---|---|---|
| Boyd Chawnette L | $84,700 | -- | |
| Green Frank | $138,094 | -- | |
| Augusta Georgia Land Bank Authority | $72,000 | -- | |
| C B Walker Contractor Inc | $82,400 | -- | |
| Vision Development Associates Llc | -- | None Available | |
| Vision Development Associates Llc | -- | -- | |
| Walker Calvin B | $7,000 | None Available |
Source: Public Records
Mortgage History
| Date | Status | Borrower | Loan Amount |
|---|---|---|---|
| Open | Boyd Chawnette L | $96,416 |
Source: Public Records
Tax History
| Year | Tax Paid | Tax Assessment Tax Assessment Total Assessment is a certain percentage of the fair market value that is determined by local assessors to be the total taxable value of land and additions on the property. | Land | Improvement |
|---|---|---|---|---|
| 2025 | $2,486 | $77,680 | $8,000 | $69,680 |
| 2024 | $2,486 | $76,964 | $8,000 | $68,964 |
| 2023 | $1,654 | $71,780 | $8,000 | $63,780 |
| 2022 | $2,306 | $70,270 | $8,000 | $62,270 |
| 2021 | $1,769 | $52,986 | $8,000 | $44,986 |
| 2020 | $1,426 | $47,125 | $8,000 | $39,125 |
| 2019 | $1,361 | $47,125 | $8,000 | $39,125 |
| 2018 | $1,221 | $47,125 | $8,000 | $39,125 |
| 2017 | $1,212 | $47,125 | $8,000 | $39,125 |
| 2016 | $1,143 | $47,125 | $8,000 | $39,125 |
| 2015 | $1,152 | $47,125 | $8,000 | $39,125 |
| 2014 | $1,152 | $47,125 | $8,000 | $39,125 |
Source: Public Records
Map
Nearby Homes
- 1126 Florence St
- 1321 11th St
- 1115 Hopkins St
- 1539 12th St
- 1538 12th St
- 1122 Miller St
- 929 Hopkins St
- 929 Miller St
- 1021 Miller St
- 1225 Miller St
- 907 Hopkins St
- 1426 Twiggs St
- 1327 Conklin Ave
- 1434 Okeefe Ln
- 1411 Maple St
- 1367 Wrightsboro Rd
- 13 Nicholas St
- 1369 Wrightsboro Rd
- 1428 Augusta Ave
- 1371 Wrightsboro Rd
Your Personal Tour Guide
Ask me questions while you tour the home.