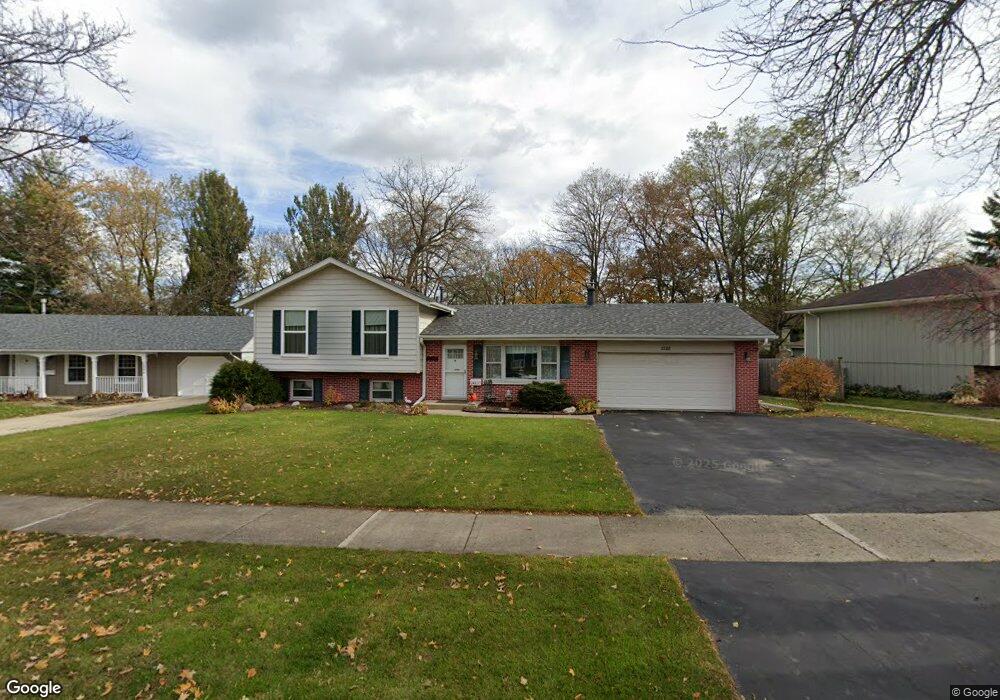
1228 Foxglade Ct Saint Charles, IL 60174
Southwest Saint Charles NeighborhoodEstimated Value: $373,341 - $435,000
4
Beds
1
Bath
1,092
Sq Ft
$371/Sq Ft
Est. Value
About This Home
This home is located at 1228 Foxglade Ct, Saint Charles, IL 60174 and is currently estimated at $405,085, approximately $370 per square foot. 1228 Foxglade Ct is a home located in Kane County with nearby schools including Davis Primary School, Richmond Intermediate School, and Thompson Middle School.
Ownership History
Date
Name
Owned For
Owner Type
Purchase Details
Closed on
Nov 16, 2018
Sold by
Holm Hilda L
Bought by
Holm Hilda and Holm Livingtrust
Current Estimated Value
Purchase Details
Closed on
Feb 16, 2001
Sold by
Zacker David and Zacker Molly M
Bought by
Holm Dennis N and Holm Hilda L
Home Financials for this Owner
Home Financials are based on the most recent Mortgage that was taken out on this home.
Original Mortgage
$191,175
Outstanding Balance
$68,176
Interest Rate
6.91%
Mortgage Type
FHA
Estimated Equity
$336,909
Purchase Details
Closed on
Apr 10, 1998
Sold by
Harrison William B and Harrison Heather A
Bought by
Zacker David and Zacker Molly Mackay
Home Financials for this Owner
Home Financials are based on the most recent Mortgage that was taken out on this home.
Original Mortgage
$152,000
Interest Rate
7.27%
Purchase Details
Closed on
Jun 30, 1995
Sold by
Stratman Matthew J and Stratman Tracy L
Bought by
Harrison William B and Harrison Heather A
Create a Home Valuation Report for This Property
The Home Valuation Report is an in-depth analysis detailing your home's value as well as a comparison with similar homes in the area
Home Values in the Area
Average Home Value in this Area
Purchase History
| Date | Buyer | Sale Price | Title Company |
|---|---|---|---|
| Holm Hilda | -- | Attorneyu | |
| Holm Dennis N | $194,000 | Chicago Title Insurance Co | |
| Zacker David | $160,000 | -- | |
| Harrison William B | $158,000 | -- |
Source: Public Records
Mortgage History
| Date | Status | Borrower | Loan Amount |
|---|---|---|---|
| Open | Holm Dennis N | $191,175 | |
| Previous Owner | Zacker David | $152,000 |
Source: Public Records
Tax History Compared to Growth
Tax History
| Year | Tax Paid | Tax Assessment Tax Assessment Total Assessment is a certain percentage of the fair market value that is determined by local assessors to be the total taxable value of land and additions on the property. | Land | Improvement |
|---|---|---|---|---|
| 2024 | $6,773 | $107,239 | $37,240 | $69,999 |
| 2023 | $6,401 | $95,980 | $33,330 | $62,650 |
| 2022 | $6,501 | $91,521 | $32,835 | $58,686 |
| 2021 | $6,218 | $87,237 | $31,298 | $55,939 |
| 2020 | $6,140 | $85,610 | $30,714 | $54,896 |
| 2019 | $6,018 | $83,915 | $30,106 | $53,809 |
| 2018 | $5,706 | $79,793 | $27,334 | $52,459 |
| 2017 | $5,536 | $77,064 | $26,399 | $50,665 |
| 2016 | $5,788 | $74,358 | $25,472 | $48,886 |
| 2015 | -- | $70,373 | $25,197 | $45,176 |
| 2014 | -- | $66,885 | $25,197 | $41,688 |
| 2013 | -- | $67,770 | $25,449 | $42,321 |
Source: Public Records
Map
Nearby Homes
- 1310 Foxglade Ct
- 1224 Foxglade Ct
- 41 White Oak Cir
- 42 White Oak Cir
- 1314 Foxglade Ct
- 40 White Oak Cir
- 43 White Oak Cir
- 39 White Oak Cir Unit 2
- 44 White Oak Cir
- 1220 Foxglade Ct
- 38 White Oak Cir
- 1227 Foxglade Ct
- 45 White Oak Cir
- 46 White Oak Cir Unit 2
- 1309 Foxglade Ct
- 1223 Foxglade Ct
- 37 White Oak Cir
- 1211 Foxglade Ct Unit 1
- 1318 Foxglade Ct
- 1313 Foxglade Ct