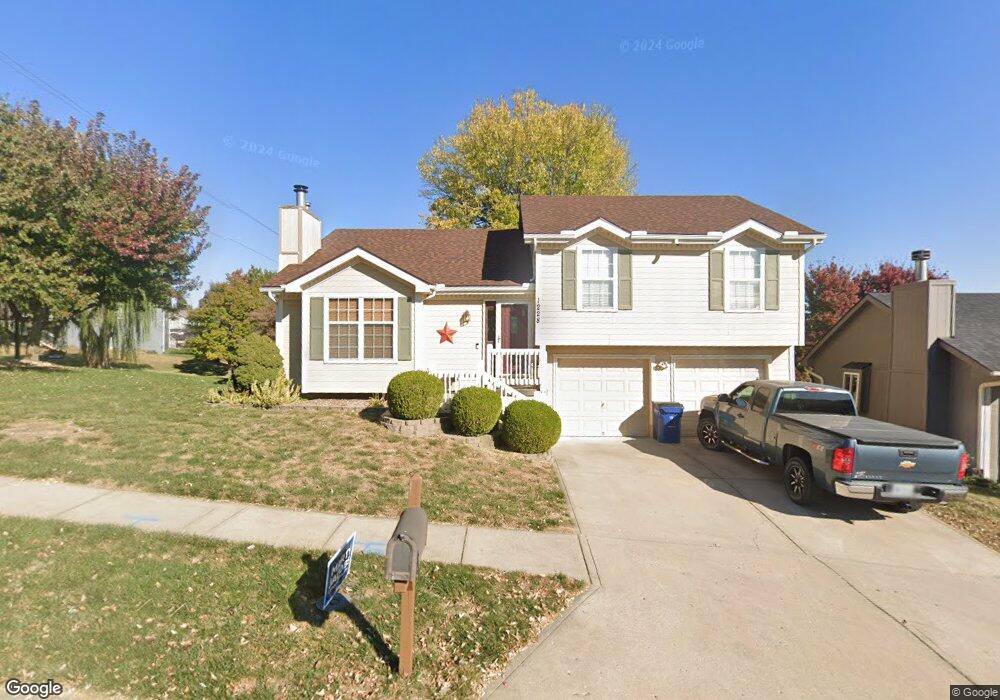
1228 Mockingbird Ln Liberty, MO 64068
Estimated Value: $300,000 - $343,000
3
Beds
3
Baths
1,596
Sq Ft
$201/Sq Ft
Est. Value
About This Home
This home is located at 1228 Mockingbird Ln, Liberty, MO 64068 and is currently estimated at $321,145, approximately $201 per square foot. 1228 Mockingbird Ln is a home located in Clay County with nearby schools including Lillian Schumacher Elementary School, Liberty Middle School, and Liberty High School.
Ownership History
Date
Name
Owned For
Owner Type
Purchase Details
Closed on
Jul 9, 2001
Sold by
Jacobson Bryce R and Jacobson Krista K
Bought by
Dwiggins Marlon and Dwiggins Paula
Current Estimated Value
Home Financials for this Owner
Home Financials are based on the most recent Mortgage that was taken out on this home.
Original Mortgage
$128,725
Outstanding Balance
$49,679
Interest Rate
7.16%
Estimated Equity
$271,466
Purchase Details
Closed on
May 14, 1999
Sold by
Seelig Timothy M
Bought by
Jacobson Bryce R and Jacobson Krista K
Home Financials for this Owner
Home Financials are based on the most recent Mortgage that was taken out on this home.
Original Mortgage
$126,432
Interest Rate
7.04%
Mortgage Type
FHA
Purchase Details
Closed on
Mar 4, 1997
Sold by
Allen Bill J and Allen Theresa C
Bought by
Seelig Timothy M
Home Financials for this Owner
Home Financials are based on the most recent Mortgage that was taken out on this home.
Original Mortgage
$107,050
Interest Rate
7.25%
Create a Home Valuation Report for This Property
The Home Valuation Report is an in-depth analysis detailing your home's value as well as a comparison with similar homes in the area
Home Values in the Area
Average Home Value in this Area
Purchase History
| Date | Buyer | Sale Price | Title Company |
|---|---|---|---|
| Dwiggins Marlon | -- | -- | |
| Jacobson Bryce R | -- | Stewart Title | |
| Seelig Timothy M | -- | Old Republic Title |
Source: Public Records
Mortgage History
| Date | Status | Borrower | Loan Amount |
|---|---|---|---|
| Open | Dwiggins Marlon | $128,725 | |
| Previous Owner | Jacobson Bryce R | $126,432 | |
| Previous Owner | Seelig Timothy M | $107,050 |
Source: Public Records
Tax History Compared to Growth
Tax History
| Year | Tax Paid | Tax Assessment Tax Assessment Total Assessment is a certain percentage of the fair market value that is determined by local assessors to be the total taxable value of land and additions on the property. | Land | Improvement |
|---|---|---|---|---|
| 2025 | $2,752 | $41,120 | -- | -- |
| 2024 | $2,752 | $35,780 | -- | -- |
| 2023 | $2,799 | $35,780 | $0 | $0 |
| 2022 | $2,666 | $33,650 | $0 | $0 |
| 2021 | $2,645 | $33,649 | $6,650 | $26,999 |
| 2020 | $2,440 | $29,150 | $0 | $0 |
| 2019 | $2,439 | $29,146 | $4,940 | $24,206 |
| 2018 | $2,277 | $26,710 | $0 | $0 |
| 2017 | $2,255 | $26,710 | $3,990 | $22,720 |
| 2016 | $2,255 | $26,710 | $3,990 | $22,720 |
| 2015 | $2,256 | $26,710 | $3,990 | $22,720 |
| 2014 | $2,160 | $25,380 | $3,990 | $21,390 |
Source: Public Records
Map
Nearby Homes
- 1905 Claywoods Pkwy
- 1847 Mallard Dr
- 1004 Hackberry Ct
- 1103 Pier
- 1876 Kingbird Ln
- 1435 Sumac Cir
- 1872 Kingbird Ln
- 3.86 acres Southview Dr
- 345 Cates Ct
- 2504 Magnolia Ave
- 1059 Fir Ln
- 450 E Ruth Ewing Rd
- 1051 Fir Ln
- 1116 Silverleaf Ln
- 1044 Silverleaf Ln
- 1027 Fir Ln
- 1007 Poplar Ln
- 1011 Poplar Ln
- 1015 Poplar Ln
- 1112 White Birch St
- 1232 Mockingbird Ln
- 1224 Mockingbird Ln
- 1236 Mockingbird Ln
- 1229 Mockingbird Ln
- 1220 Mockingbird Ln
- 1233 Mockingbird Ln
- 1225 Mockingbird Ln
- 1217 Meadowlark Ct
- 1237 Mockingbird Ln
- 1221 Meadowlark Ct
- 1240 Mockingbird Ln
- 1216 Mockingbird Ln
- 1221 Mockingbird Ln
- 1213 Meadowlark Ct
- 1232 Pheasant Ct
- 1244 Mockingbird Ln
- 1224 Meadowlark Ct
- 1241 Mockingbird Ln
- 1245 Mockingbird Ln
- 1868 Claywoods Pkwy