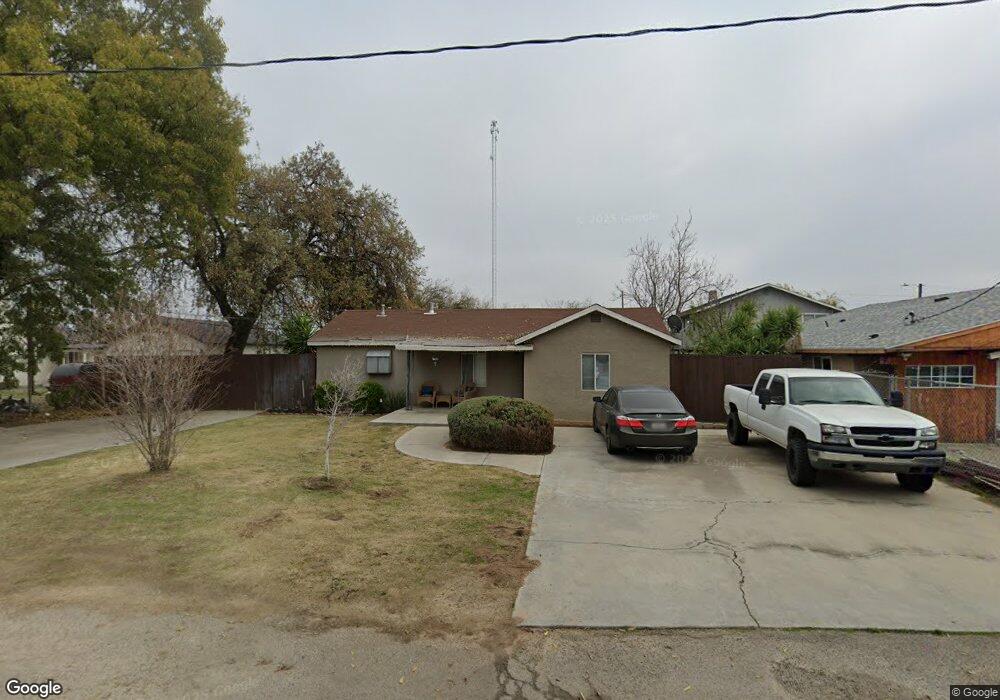
1228 S Berkeley Ave Turlock, CA 95380
Estimated Value: $362,371 - $433,000
2
Beds
1
Bath
895
Sq Ft
$429/Sq Ft
Est. Value
About This Home
This home is located at 1228 S Berkeley Ave, Turlock, CA 95380 and is currently estimated at $384,343, approximately $429 per square foot. 1228 S Berkeley Ave is a home located in Stanislaus County with nearby schools including Julien Elementary School, Marvin A. Dutcher Middle School, and Turlock Junior High School.
Ownership History
Date
Name
Owned For
Owner Type
Purchase Details
Closed on
Jan 19, 2022
Sold by
Leeroy Gonzales
Bought by
L Gonzales 2022 Trust
Current Estimated Value
Purchase Details
Closed on
Nov 22, 2005
Sold by
Gonzales Leeroy
Bought by
Gonzales Lee Roy and Gonzales Eloida
Home Financials for this Owner
Home Financials are based on the most recent Mortgage that was taken out on this home.
Original Mortgage
$260,000
Interest Rate
5.97%
Mortgage Type
New Conventional
Create a Home Valuation Report for This Property
The Home Valuation Report is an in-depth analysis detailing your home's value as well as a comparison with similar homes in the area
Purchase History
| Date | Buyer | Sale Price | Title Company |
|---|---|---|---|
| L Gonzales 2022 Trust | -- | None Listed On Document | |
| Gonzales Lee Roy | -- | Alliance Title Company | |
| Gonzales Leeroy | -- | Alliance Title Company |
Source: Public Records
Mortgage History
| Date | Status | Borrower | Loan Amount |
|---|---|---|---|
| Previous Owner | Gonzales Leeroy | $260,000 |
Source: Public Records
Tax History
| Year | Tax Paid | Tax Assessment Tax Assessment Total Assessment is a certain percentage of the fair market value that is determined by local assessors to be the total taxable value of land and additions on the property. | Land | Improvement |
|---|---|---|---|---|
| 2025 | $1,742 | $158,577 | $93,783 | $64,794 |
| 2024 | $1,711 | $155,469 | $91,945 | $63,524 |
| 2023 | $1,707 | $152,422 | $90,143 | $62,279 |
| 2022 | $1,687 | $149,434 | $88,376 | $61,058 |
| 2021 | $1,662 | $146,505 | $86,644 | $59,861 |
| 2020 | $1,651 | $145,004 | $85,756 | $59,248 |
| 2019 | $1,624 | $142,162 | $84,075 | $58,087 |
| 2018 | $1,623 | $139,376 | $82,427 | $56,949 |
| 2017 | $1,586 | $136,644 | $80,811 | $55,833 |
| 2016 | $1,484 | $133,966 | $79,227 | $54,739 |
| 2015 | $1,471 | $131,954 | $78,037 | $53,917 |
| 2014 | $1,457 | $129,370 | $76,509 | $52,861 |
Source: Public Records
Map
Nearby Homes
- 938 Zina Ln
- 1412 S 1st St Unit B
- 436 Lemongrass St
- 440 Lemongrass St
- 445 Lemongrass St
- 449 Lemongrass St
- 1040 S Rose St
- 1202 Impression St
- 1412 E Glenwood Ave
- 2213 Evelle Ln
- 1030 Alpha Rd
- 102 I St
- 411 Bothun Rd
- 401 Bothun Rd
- 1165 Boxwood Way
- 1598 East Ave
- 310 W F St
- 599 S Minaret Ave
- 432 E Glenwood Ave
- 528 S Minaret Ave
Your Personal Tour Guide
Ask me questions while you tour the home.