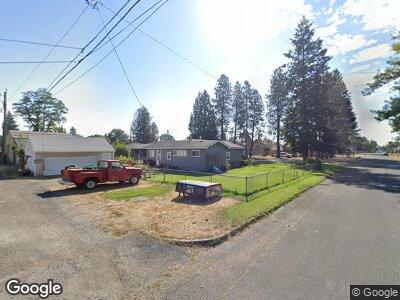
1228 W Joseph Ave Spokane, WA 99205
North Hill NeighborhoodEstimated Value: $264,424 - $292,000
3
Beds
1
Bath
1,350
Sq Ft
$205/Sq Ft
Est. Value
About This Home
This home is located at 1228 W Joseph Ave, Spokane, WA 99205 and is currently estimated at $276,606, approximately $204 per square foot. 1228 W Joseph Ave is a home located in Spokane County with nearby schools including Ridgeview Elementary School, Salk Middle School, and Shadle Park High School.
Ownership History
Date
Name
Owned For
Owner Type
Purchase Details
Closed on
Feb 16, 2018
Sold by
Mcdonald Floyd L
Bought by
Dalebout Chad M and Dalebout Victoria A
Current Estimated Value
Home Financials for this Owner
Home Financials are based on the most recent Mortgage that was taken out on this home.
Original Mortgage
$68,250
Outstanding Balance
$59,367
Interest Rate
3.99%
Mortgage Type
New Conventional
Purchase Details
Closed on
Aug 25, 2000
Sold by
Hud
Bought by
Mcdonald Floyd L and Mcdonald Virginia R
Home Financials for this Owner
Home Financials are based on the most recent Mortgage that was taken out on this home.
Original Mortgage
$58,200
Interest Rate
8.11%
Purchase Details
Closed on
May 15, 2000
Sold by
Chase Manhattan Mtg Corp
Bought by
Hud
Purchase Details
Closed on
Aug 17, 1999
Sold by
Bogenreif Michael J and Bogenreif Christina L
Bought by
Chemical Residential Mtg Corp and Chase Manhattan Mtg Corp
Create a Home Valuation Report for This Property
The Home Valuation Report is an in-depth analysis detailing your home's value as well as a comparison with similar homes in the area
Home Values in the Area
Average Home Value in this Area
Purchase History
| Date | Buyer | Sale Price | Title Company |
|---|---|---|---|
| Dalebout Chad M | $91,000 | First American Title | |
| Mcdonald Floyd L | -- | First American Title Ins | |
| Hud | -- | First American Title Ins | |
| Chemical Residential Mtg Corp | $83,761 | First American Title Ins |
Source: Public Records
Mortgage History
| Date | Status | Borrower | Loan Amount |
|---|---|---|---|
| Open | Dalebout Chad M | $68,250 | |
| Previous Owner | Mcdonald Floyd L | $110,300 | |
| Previous Owner | Mcdonald Floyd L | $25,000 | |
| Previous Owner | Mcdonald Floyd L | $58,200 |
Source: Public Records
Tax History Compared to Growth
Tax History
| Year | Tax Paid | Tax Assessment Tax Assessment Total Assessment is a certain percentage of the fair market value that is determined by local assessors to be the total taxable value of land and additions on the property. | Land | Improvement |
|---|---|---|---|---|
| 2024 | $2,386 | $240,000 | $70,000 | $170,000 |
| 2023 | $2,178 | $235,500 | $60,000 | $175,500 |
| 2022 | $1,988 | $222,200 | $60,000 | $162,200 |
| 2021 | $1,743 | $146,000 | $32,000 | $114,000 |
| 2020 | $1,571 | $126,700 | $30,000 | $96,700 |
| 2019 | $1,388 | $115,800 | $25,000 | $90,800 |
| 2018 | $1,627 | $116,700 | $25,000 | $91,700 |
| 2017 | $320 | $110,200 | $25,000 | $85,200 |
| 2016 | $329 | $101,500 | $25,000 | $76,500 |
| 2015 | $415 | $98,900 | $25,000 | $73,900 |
| 2014 | -- | $91,700 | $25,000 | $66,700 |
| 2013 | -- | $0 | $0 | $0 |
Source: Public Records
Map
Nearby Homes
- 1323 W Joseph Ave
- 5707 N Cedar St
- 1110 W Central Ave
- 5503 N Cedar St
- 5427 N Monroe St
- 5934 N Buffalo St
- 1324 W Dalke Ave
- 5616 N Lincoln St
- 6011 N Monroe St
- 6004 N Monroe St
- 5317 N Walnut St
- 5407 N Maple St
- 5204 N Adams St
- 5217 N Monroe St
- 6124 N Monroe St
- 6128 N Maple St
- 5328 N Oak St
- 5207 N Maple St
- 5127 N Lincoln St
- 5014 N Adams St
- 1228 W Joseph Ave
- 1222 W Joseph Ave
- 1218 W Joseph Ave
- 1306 W Joseph Ave
- 1227 W Columbia Ave
- 1214 W Joseph Ave
- 1221 W Columbia Ave
- 1227 W Joseph Ave
- 1303 W Columbia Ave
- 1310 W Joseph Ave
- 1211 W Columbia Ave
- 1303 W Joseph Ave
- 1307 W Columbia Ave
- 1204 W Joseph Ave
- 1307 W Joseph Ave
- 1316 W Joseph Ave
- 1203 W Columbia Ave
- 1311 W Columbia Ave
- 1311 W Joseph Ave
- 1315 W Columbia Ave