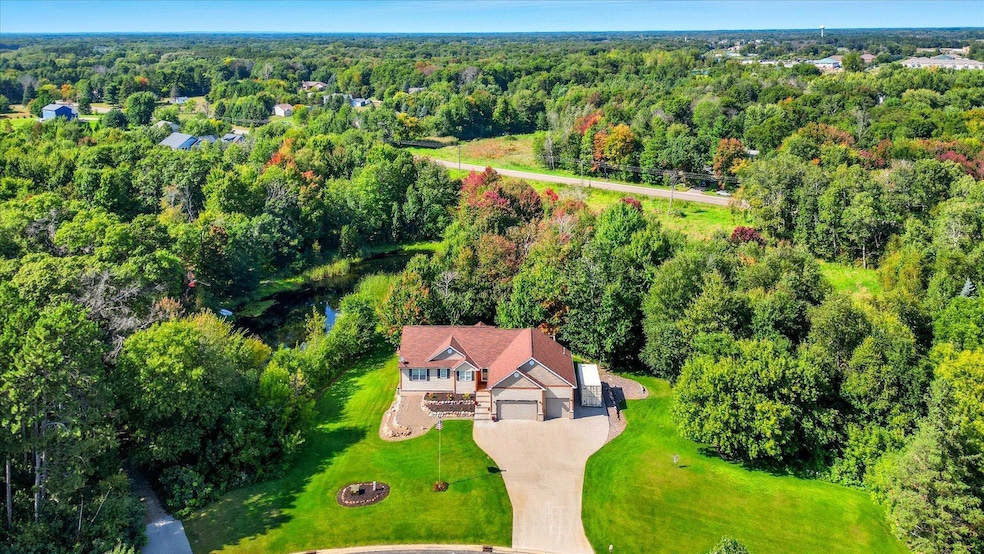
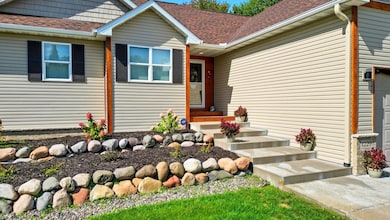
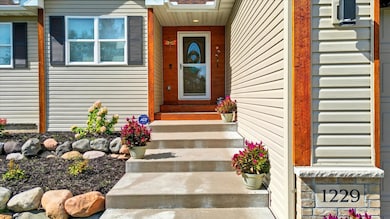
1229 180th Ln NE Andover, MN 55304
Estimated payment $4,065/month
Highlights
- Home fronts a pond
- 159,430 Sq Ft lot
- Main Floor Primary Bedroom
- Rum River Elementary School Rated A-
- Deck
- Mud Room
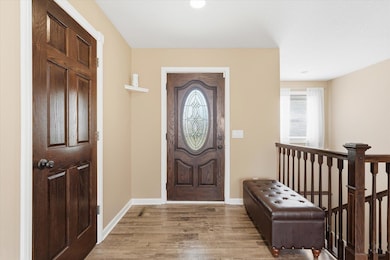
About This Home
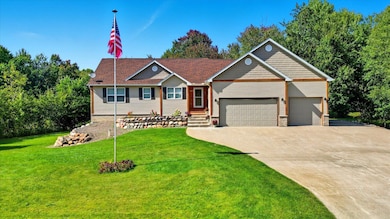
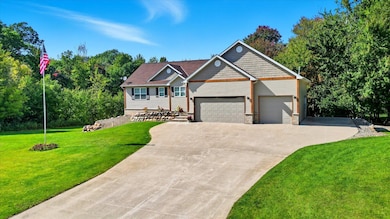
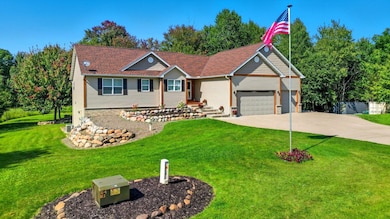
Enjoy nearly 4 acres of peaceful privacy on a quiet cul-de-sac in this beautifully maintained 4-bed, 3-bath home! The bright, open main level welcomes you with large windows that flood rooms with natural light. The kitchen’s granite counters, energy-efficient appliances, walk-in corner pantry and island with breakfast bar make meal prep and casual entertaining effortless. Main-level laundry adds everyday convenience, and the primary suite offers a walk-in closet plus a private bath with soaking tub and separate shower for real relaxation. The newly finished walk-out lower level expands your living and entertaining options with a huge family room, wet-bar hookups, surround sound, tray ceiling lighting and smart-home wiring — it opens directly to a lower patio for easy indoor/outdoor flow. Step outside and you’ll find space to relax, entertain, and play — from the composite deck overlooking a serene yard with a peaceful pond view, to the brick-paver fire pit perfect for evening gatherings, and even your own 9-hole frisbee golf course that winds through the property and neighborhood. With a heated 3-car garage, RV parking, and thoughtful updates throughout, this home combines modern comfort with exceptional indoor/outdoor living!
Home Details
Home Type
- Single Family
Est. Annual Taxes
- $4,509
Year Built
- Built in 2015
Lot Details
- 3.66 Acre Lot
- Home fronts a pond
Parking
- 3 Car Attached Garage
- Electric Vehicle Home Charger
- Parking Storage or Cabinetry
- Heated Garage
- Insulated Garage
- Garage Door Opener
Home Design
- Vinyl Siding
- Cedar
Interior Spaces
- 2-Story Property
- Whole House Fan
- Mud Room
- Family Room
- Living Room
- Dining Room
Kitchen
- Walk-In Pantry
- Range
- Microwave
- Freezer
- Dishwasher
- Stainless Steel Appliances
- The kitchen features windows
Bedrooms and Bathrooms
- 4 Bedrooms
- Primary Bedroom on Main
- En-Suite Bathroom
- Walk-In Closet
- 3 Full Bathrooms
- Soaking Tub
Laundry
- Laundry Room
- Dryer
- Washer
Finished Basement
- Walk-Out Basement
- Basement Fills Entire Space Under The House
- Drainage System
- Sump Pump
- Drain
- Block Basement Construction
- Basement Storage
- Natural lighting in basement
Utilities
- Forced Air Heating and Cooling System
- Vented Exhaust Fan
- 200+ Amp Service
- 100 Amp Service
- 60 Amp Service
- Water Filtration System
- Well
- Gas Water Heater
- Water Softener is Owned
- Septic System
Additional Features
- Smart Technology
- Air Exchanger
- Deck
Community Details
- No Home Owners Association
- Rosewood Add Subdivision
Listing and Financial Details
- Assessor Parcel Number 053223210008
Map
Home Values in the Area
Average Home Value in this Area
Tax History
| Year | Tax Paid | Tax Assessment Tax Assessment Total Assessment is a certain percentage of the fair market value that is determined by local assessors to be the total taxable value of land and additions on the property. | Land | Improvement |
|---|---|---|---|---|
| 2025 | $4,509 | $523,600 | $164,200 | $359,400 |
| 2024 | $4,509 | $516,100 | $164,200 | $351,900 |
| 2023 | $4,073 | $499,500 | $137,800 | $361,700 |
| 2022 | $3,908 | $492,100 | $125,100 | $367,000 |
| 2021 | $3,705 | $411,900 | $100,200 | $311,700 |
| 2020 | $3,747 | $384,100 | $90,000 | $294,100 |
| 2019 | $3,649 | $374,200 | $99,000 | $275,200 |
| 2018 | $3,466 | $352,900 | $0 | $0 |
| 2017 | $2,493 | $323,100 | $0 | $0 |
| 2016 | $745 | $54,800 | $0 | $0 |
| 2015 | -- | $54,800 | $54,800 | $0 |
| 2014 | -- | $63,000 | $63,000 | $0 |
Property History
| Date | Event | Price | List to Sale | Price per Sq Ft |
|---|---|---|---|---|
| 11/18/2025 11/18/25 | Pending | -- | -- | -- |
| 10/31/2025 10/31/25 | For Sale | $699,900 | -- | $252 / Sq Ft |
Purchase History
| Date | Type | Sale Price | Title Company |
|---|---|---|---|
| Warranty Deed | $317,000 | All American Title Company | |
| Warranty Deed | $85,000 | Attorney | |
| Contract Of Sale | $85,000 | Edina Realty Title Inc |
Mortgage History
| Date | Status | Loan Amount | Loan Type |
|---|---|---|---|
| Open | $317,000 | VA | |
| Previous Owner | $70,550 | Seller Take Back |
Source: NorthstarMLS
MLS Number: 6785831
APN: 05-32-23-21-0008
Disclaimer: Certain information contained herein is derived from information provided by parties other than Homes.com. All information provided is deemed reliable, but is not guaranteed to be accurate and should be independently verified.
![]() Based on information submitted to the MLS GRID. All data is obtained from various sources and may not have been verified by broker or MLS GRID. Supplied Open House Information is subject to change without notice. All information should be independently reviewed and verified for accuracy. Properties may or may not be listed by the office/agent presenting the information. Some IDX listings have been excluded from this website.
Based on information submitted to the MLS GRID. All data is obtained from various sources and may not have been verified by broker or MLS GRID. Supplied Open House Information is subject to change without notice. All information should be independently reviewed and verified for accuracy. Properties may or may not be listed by the office/agent presenting the information. Some IDX listings have been excluded from this website.
The Digital Millennium Copyright Act of 1998, 17 U.S.C. § 512 (the “DMCA”) provides recourse for copyright owners who believe that material appearing on the Internet infringes their rights under U.S. copyright law. If you believe in good faith that any content or material made available in connection with our website or services infringes your copyright, you (or your agent) may send us a notice requesting that the content or material be removed, or access to it blocked.
Notices must be sent in writing by email to DMCAnotice@MLSGrid.com.
The DMCA requires that your notice of alleged copyright infringement include the following information:
(1) description of the copyrighted work that is the subject of claimed infringement;
(2) description of the alleged infringing content and information sufficient to permit us to locate the content;
(3) contact information for you, including your address, telephone number and email address;
(4) a statement by you that you have a good faith belief that the content in the manner complained of is not authorized by the copyright owner, or its agent, or by the operation of any law;
(5) a statement by you, signed under penalty of perjury, that the information in the notification is accurate and that you have the authority to enforce the copyrights that are claimed to be infringed; and
(6) a physical or electronic signature of the copyright owner or a person authorized to act on the copyright owner’s behalf. Failure to include all of the above information may result in the delay of the processing of your complaint.
- 2463 180th Ln NE
- 2451 180th Ln NE
- 1X Highway 65 NE
- 17749 Johnson St NE
- xxx 180th Ln NE
- 15218 Quince St NW
- 18410 Jackson St NE
- 17205 Lincoln St NE
- 17655 London St NE
- 2336 Swedish Dr NE
- 17982 Staples St NE
- 1605 Meadows Dr
- 1564 Meadows Dr
- 1500 Meadows Dr
- 2139 Soderville Dr NE
- 2374 Swedish Dr NE
- 2230 Briarwood Ln NE
- 18071 Urbank St NE
- TBD 169th Ave NE
- 825 174th Ave NE
