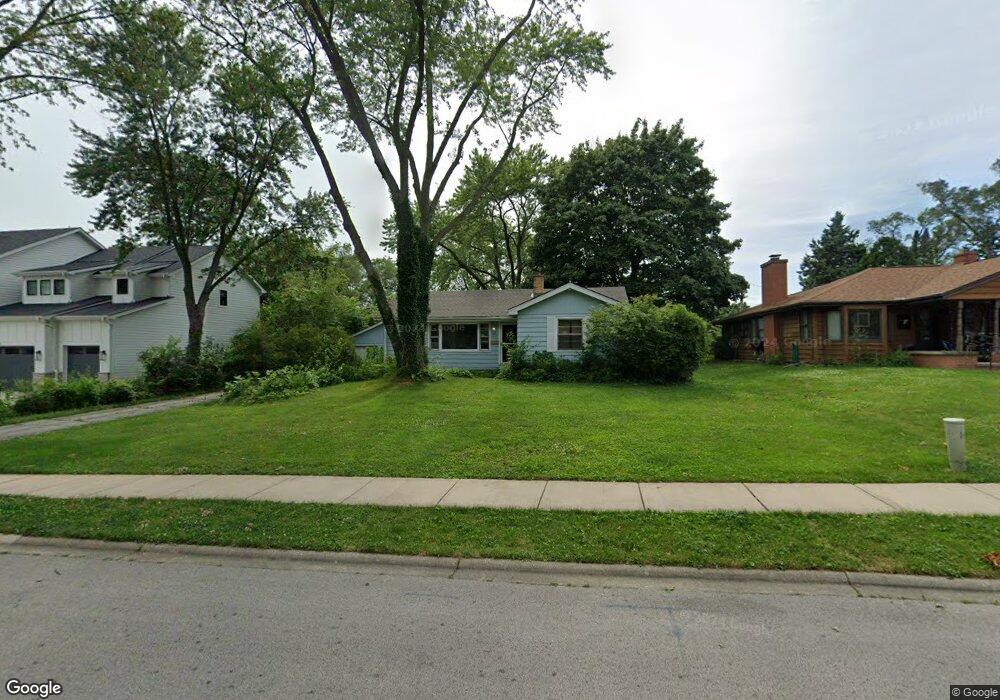
1229 N Eagle St Naperville, IL 60563
North Naperville NeighborhoodEstimated Value: $580,000 - $703,000
4
Beds
2
Baths
1,528
Sq Ft
$434/Sq Ft
Est. Value
About This Home
This home is located at 1229 N Eagle St, Naperville, IL 60563 and is currently estimated at $663,369, approximately $434 per square foot. 1229 N Eagle St is a home located in DuPage County with nearby schools including Mill Street Elementary School, Jefferson Jr High School, and Naperville North High School.
Ownership History
Date
Name
Owned For
Owner Type
Purchase Details
Closed on
Jun 18, 2024
Sold by
Baxley Kristin J and Wiesbrook Alan D
Bought by
Williamson Sunita
Current Estimated Value
Purchase Details
Closed on
Jul 27, 1995
Sold by
Saumweber Les and Saumweber Jan
Bought by
Wiesbrook Alan D and Baxley Kristin J
Home Financials for this Owner
Home Financials are based on the most recent Mortgage that was taken out on this home.
Original Mortgage
$128,000
Interest Rate
7%
Purchase Details
Closed on
Apr 5, 1995
Sold by
Johnson Jonathan R and Johnson Jennifer
Bought by
Saumweber Les and Saumweber Jan
Home Financials for this Owner
Home Financials are based on the most recent Mortgage that was taken out on this home.
Original Mortgage
$118,400
Interest Rate
7.87%
Create a Home Valuation Report for This Property
The Home Valuation Report is an in-depth analysis detailing your home's value as well as a comparison with similar homes in the area
Home Values in the Area
Average Home Value in this Area
Purchase History
| Date | Buyer | Sale Price | Title Company |
|---|---|---|---|
| Williamson Sunita | $712,000 | Greater Illinois Title | |
| Wiesbrook Alan D | $160,000 | Attorneys Title Guaranty Fun | |
| Saumweber Les | $148,000 | First American Title |
Source: Public Records
Mortgage History
| Date | Status | Borrower | Loan Amount |
|---|---|---|---|
| Previous Owner | Wiesbrook Alan D | $128,000 | |
| Previous Owner | Saumweber Les | $118,400 |
Source: Public Records
Tax History
| Year | Tax Paid | Tax Assessment Tax Assessment Total Assessment is a certain percentage of the fair market value that is determined by local assessors to be the total taxable value of land and additions on the property. | Land | Improvement |
|---|---|---|---|---|
| 2024 | $9,912 | $169,628 | $128,440 | $41,188 |
| 2023 | $9,371 | $152,420 | $115,410 | $37,010 |
| 2022 | $8,658 | $140,000 | $105,690 | $34,310 |
| 2021 | $8,351 | $135,010 | $101,920 | $33,090 |
| 2020 | $8,325 | $135,010 | $101,920 | $33,090 |
| 2019 | $8,024 | $128,410 | $96,940 | $31,470 |
| 2018 | $7,729 | $124,070 | $93,290 | $30,780 |
| 2017 | $7,568 | $119,870 | $90,130 | $29,740 |
| 2016 | $7,382 | $115,040 | $86,500 | $28,540 |
| 2015 | $7,387 | $109,230 | $82,130 | $27,100 |
| 2014 | $7,425 | $106,590 | $79,910 | $26,680 |
| 2013 | $7,374 | $107,320 | $80,460 | $26,860 |
Source: Public Records
Map
Nearby Homes
- 1310 Eagle St
- 1314 N Eagle St
- 1142 N Webster St
- 1052 N Mill St Unit 111
- 1104 N Mill St Unit 205
- 1105 N Mill St Unit 224
- 1004 N Mill St Unit 312
- 1004 N Mill St Unit 5302
- 905 N Webster St
- 1041 N Mill St Unit 307
- 1041 N Mill St Unit 203
- 1001 N Mill St Unit 203
- 1001 N Mill St Unit 302
- 1427 Cress Creek Ct
- 613 Zaininger Ave
- 27W141 48th St
- 660 N Eagle St
- 971 West Ct Unit B
- 809 N Brainard St
- 729 Burning Tree Ln
- 1237 N Eagle St
- 1225 N Eagle St
- 1241 N Eagle St
- 1245 N Eagle St
- 1219 N Eagle St
- 1236 N Eagle St
- 1232 N Eagle St
- 1240 N Eagle St
- 230 W 13th Ave
- 1226 N Eagle St
- 1222 N Eagle St
- 1209 N Eagle St
- 1309 N Eagle St
- 1216 N Eagle St
- 229 W 13th Ave
- 1212 N Eagle St
- 1317 N Eagle St
- 1207 N Eagle St
- 1235 N Webster St
- 210 W 13th Ave
Your Personal Tour Guide
Ask me questions while you tour the home.