12295 Cornwallis Square Unit 121 San Diego, CA 92128
Carmel Mountain NeighborhoodEstimated Value: $1,302,211 - $1,393,000
4
Beds
3
Baths
2,221
Sq Ft
$603/Sq Ft
Est. Value
About This Home
This home is located at 12295 Cornwallis Square Unit 121, San Diego, CA 92128 and is currently estimated at $1,338,803, approximately $602 per square foot. 12295 Cornwallis Square Unit 121 is a home located in San Diego County with nearby schools including Highland Ranch Elementary School, Meadowbrook Middle, and Rancho Bernardo High.
Ownership History
Date
Name
Owned For
Owner Type
Purchase Details
Closed on
Dec 21, 2009
Sold by
Tennant Robert S and Tennant Nanette M
Bought by
Tennant Robert S and Tennant Nanette M
Current Estimated Value
Purchase Details
Closed on
Jul 19, 2009
Sold by
Tennant Nanette M and Orenstein Nanette M
Bought by
Tennant Nanette M and Tennant Robert S
Home Financials for this Owner
Home Financials are based on the most recent Mortgage that was taken out on this home.
Original Mortgage
$379,000
Interest Rate
4.81%
Mortgage Type
Stand Alone Refi Refinance Of Original Loan
Purchase Details
Closed on
Aug 6, 2003
Sold by
Johnson David L
Bought by
Orenstein Nanette M
Home Financials for this Owner
Home Financials are based on the most recent Mortgage that was taken out on this home.
Original Mortgage
$275,000
Interest Rate
5.87%
Mortgage Type
Purchase Money Mortgage
Purchase Details
Closed on
Aug 11, 1989
Create a Home Valuation Report for This Property
The Home Valuation Report is an in-depth analysis detailing your home's value as well as a comparison with similar homes in the area
Home Values in the Area
Average Home Value in this Area
Purchase History
| Date | Buyer | Sale Price | Title Company |
|---|---|---|---|
| Tennant Robert S | -- | None Available | |
| Tennant Nanette M | -- | Lsi | |
| Orenstein Nanette M | $475,000 | Commonwealth Land Title Co | |
| -- | $256,200 | -- |
Source: Public Records
Mortgage History
| Date | Status | Borrower | Loan Amount |
|---|---|---|---|
| Closed | Tennant Nanette M | $379,000 | |
| Closed | Orenstein Nanette M | $275,000 |
Source: Public Records
Tax History Compared to Growth
Tax History
| Year | Tax Paid | Tax Assessment Tax Assessment Total Assessment is a certain percentage of the fair market value that is determined by local assessors to be the total taxable value of land and additions on the property. | Land | Improvement |
|---|---|---|---|---|
| 2025 | $7,025 | $675,339 | $156,393 | $518,946 |
| 2024 | $7,025 | $662,098 | $153,327 | $508,771 |
| 2023 | $6,873 | $649,117 | $150,321 | $498,796 |
| 2022 | $6,768 | $636,390 | $147,374 | $489,016 |
| 2021 | $6,641 | $623,913 | $144,485 | $479,428 |
| 2020 | $6,570 | $617,517 | $143,004 | $474,513 |
| 2019 | $6,402 | $605,409 | $140,200 | $465,209 |
| 2018 | $6,222 | $593,539 | $137,451 | $456,088 |
| 2017 | $6,097 | $581,902 | $134,756 | $447,146 |
| 2016 | $5,973 | $570,493 | $132,114 | $438,379 |
| 2015 | $5,883 | $561,925 | $130,130 | $431,795 |
| 2014 | $5,742 | $550,918 | $127,581 | $423,337 |
Source: Public Records
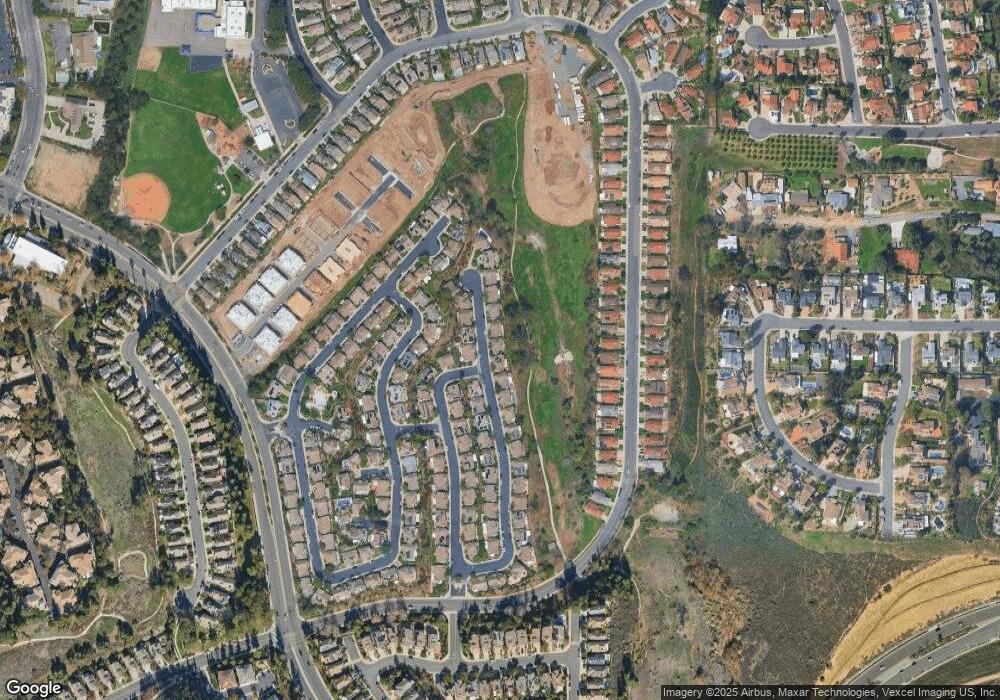
Map
Nearby Homes
- 14230 Jonah Way
- Residence 3 Plan at The Trails - Lavender
- Residence 6 Plan at The Trails - Lavender
- Residence 1 Plan at The Trails - Lavender
- Residence 4 Plan at The Trails - Lavender
- Residence 2 Plan at The Trails - Lavender
- Residence 5 Plan at The Trails - Lavender
- 12112 Carter Ln
- 14106 Brent Wilsey Place Unit 3
- 11986 Tivoli Park Row
- 12127 Corte Napoli
- 12047 Tivoli Park Row Unit 3
- 14215 Jonah Way
- 12194 Wilsey Way
- 12216 Holland Rd
- 000 Twin Peaks Rd Unit 18
- 13737 Esprit Ave
- 0 La Manda Dr Unit 250023234
- 15016 Avenida Venusto Unit 161
- 13703 Tradition St
- 12311 Cornwallis Square
- 12324 Cornwallis Square
- 12312 Cornwallis Square
- 12304 Cornwallis Square Unit 139
- 12294 Cornwallis Square Unit 138
- 12274 Cornwallis Square
- 12262 Cornwallis Square
- 12242 Cornwallis Square
- 12234 Cornwallis Square
- 12209 Cornwallis Square
- 12217 Cornwallis Square
- 12225 Cornwallis Square Unit 129
- 12249 Cornwallis Square
- 12265 Cornwallis Square Unit 124
- 12319 Cornwallis Square
- 12327 Cornwallis Square Unit 118
- 12343 Cornwallis Square Unit 116
- 12282 Cornwallis Square Unit 137
- 12254 Cornwallis Square
- 12233 Cornwallis Square