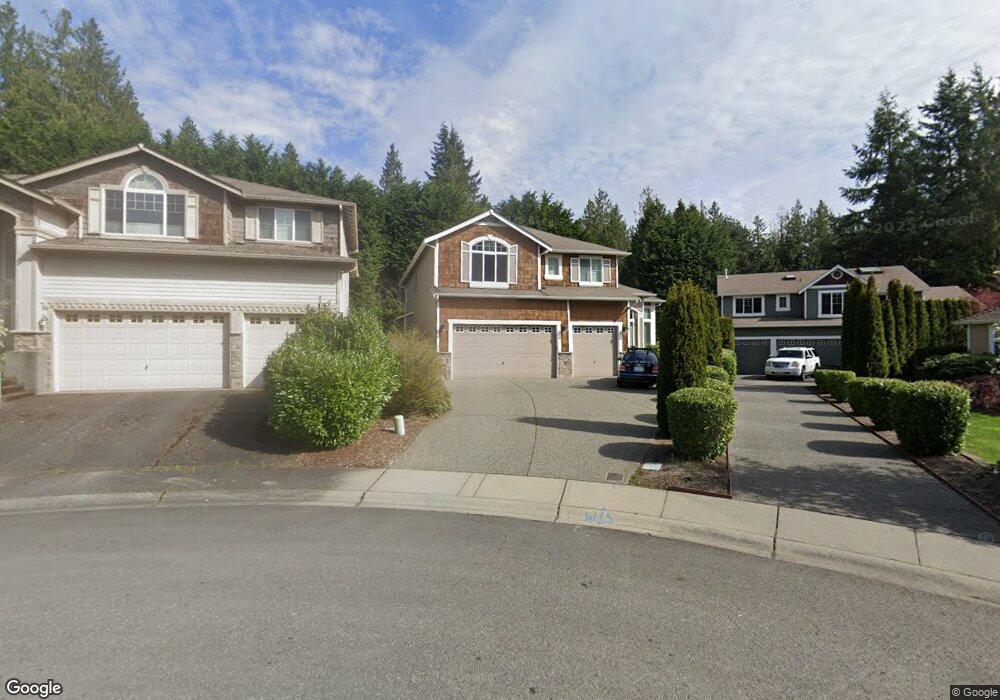
123 167th Place SE Bothell, WA 98012
Estimated Value: $1,168,000 - $1,266,484
3
Beds
3
Baths
2,999
Sq Ft
$408/Sq Ft
Est. Value
About This Home
This home is located at 123 167th Place SE, Bothell, WA 98012 and is currently estimated at $1,222,371, approximately $407 per square foot. 123 167th Place SE is a home located in Snohomish County with nearby schools including Martha Lake Elementary School, Alderwood Middle School, and Lynnwood High School.
Ownership History
Date
Name
Owned For
Owner Type
Purchase Details
Closed on
Feb 7, 2011
Sold by
Miller Angela L Rayborn and Rayborn Angela L
Bought by
Sandberg Christopher S and Sandberg Katherine M
Current Estimated Value
Home Financials for this Owner
Home Financials are based on the most recent Mortgage that was taken out on this home.
Original Mortgage
$308,000
Outstanding Balance
$204,952
Interest Rate
4.67%
Mortgage Type
New Conventional
Estimated Equity
$1,017,419
Purchase Details
Closed on
Oct 6, 2005
Sold by
The Almark Corp
Bought by
Miller Thomas K and Rayborn Angela L
Home Financials for this Owner
Home Financials are based on the most recent Mortgage that was taken out on this home.
Original Mortgage
$99,100
Interest Rate
5.23%
Mortgage Type
Stand Alone Second
Create a Home Valuation Report for This Property
The Home Valuation Report is an in-depth analysis detailing your home's value as well as a comparison with similar homes in the area
Home Values in the Area
Average Home Value in this Area
Purchase History
| Date | Buyer | Sale Price | Title Company |
|---|---|---|---|
| Sandberg Christopher S | $385,000 | Ticor Title | |
| Miller Thomas K | $495,500 | Chicago Title Insurance Co |
Source: Public Records
Mortgage History
| Date | Status | Borrower | Loan Amount |
|---|---|---|---|
| Open | Sandberg Christopher S | $308,000 | |
| Previous Owner | Miller Thomas K | $99,100 | |
| Previous Owner | Miller Thomas K | $396,400 |
Source: Public Records
Tax History
| Year | Tax Paid | Tax Assessment Tax Assessment Total Assessment is a certain percentage of the fair market value that is determined by local assessors to be the total taxable value of land and additions on the property. | Land | Improvement |
|---|---|---|---|---|
| 2026 | $8,745 | $1,145,300 | $590,000 | $555,300 |
| 2025 | $8,320 | $1,066,200 | $535,000 | $531,200 |
| 2024 | $8,320 | $1,009,800 | $515,000 | $494,800 |
| 2023 | $9,146 | $1,162,600 | $600,000 | $562,600 |
| 2022 | $8,133 | $840,600 | $363,000 | $477,600 |
| 2020 | $7,745 | $706,000 | $296,000 | $410,000 |
| 2019 | $7,179 | $651,100 | $245,000 | $406,100 |
| 2018 | $7,272 | $581,400 | $215,000 | $366,400 |
| 2017 | $6,288 | $520,500 | $178,000 | $342,500 |
| 2016 | $5,935 | $493,100 | $165,000 | $328,100 |
| 2015 | $5,818 | $459,400 | $148,000 | $311,400 |
| 2013 | $5,158 | $386,700 | $118,000 | $268,700 |
Source: Public Records
Map
Nearby Homes
- 16719 1st Ave SE
- 16528 2nd Park SE
- 115 170th St SE
- 311 168th Place SE
- 312 168th Place SE
- 129 164th Place SE
- 16230 3rd Ave SE Unit A1
- 107 164th St SE Unit 2103
- 107 164th St SE Unit 3-402
- 107 164th St SE Unit 2-301
- 118 169th Place SW Unit B
- 114 169th Place SW Unit B
- 110 169th Place SW Unit A
- 110 169th Place SW Unit B
- 207 169th Place SW
- 15 164th St SW Unit 2
- 17210 4th Dr SE
- 118 171st Place SW Unit B
- 109 161st Place SE
- 16223 5th Ave SE
- 127 167th Place SE
- 119 167th Place SE
- 119 167th Place SE
- 131 167th Place SE
- 131 167th Place SE
- 16629 1st Ave SE
- 115 167th Place SE
- 113 167th Place SE
- 16625 1st Ave SE
- 16726 3rd Ave SE
- 109 167th Place SE
- 16620 3rd Ave SE
- 107 167th Place SE
- 16621 1st Ave SE
- 16721 1st Ave SE
- 16723 1st Ave SE
- 103 167th Place SE
- 202 168th St SE
- 103 167th Place SE
- 16722 3rd Ave SE
Your Personal Tour Guide
Ask me questions while you tour the home.