U
Seller's Agent in 2025
Unrepresented Seller
Unrepresented Seller
Sold
Last Agent to Sell the Property
Unrepresented Seller
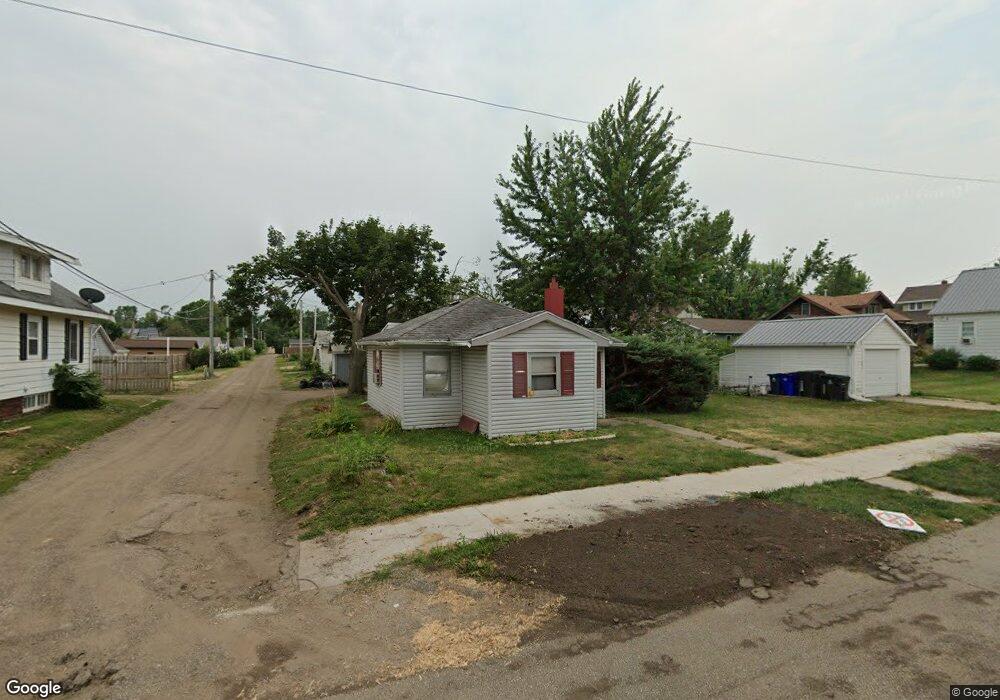
Unrepresented Seller Listed on: 06/09/2025
| Date | Type | Sale Price | Title Company |
|---|---|---|---|
| Warranty Deed | $135,000 | None Listed On Document | |
| Warranty Deed | $135,000 | None Listed On Document | |
| Warranty Deed | $115,000 | -- | |
| Special Warranty Deed | $27,500 | None Available | |
| Sheriffs Deed | $40,500 | None Available | |
| Warranty Deed | -- | -- | |
| Warranty Deed | -- | -- | |
| Warranty Deed | -- | -- | |
| Warranty Deed | $52,500 | -- |
| Date | Status | Loan Amount | Loan Type |
|---|---|---|---|
| Open | $6,750 | New Conventional | |
| Closed | $6,750 | New Conventional | |
| Open | $130,000 | New Conventional | |
| Closed | $130,000 | New Conventional | |
| Previous Owner | $92,000 | New Conventional | |
| Previous Owner | $22,400 | New Conventional | |
| Previous Owner | $53,000 | No Value Available |
| Date | Event | Price | List to Sale | Price per Sq Ft | Prior Sale |
|---|---|---|---|---|---|
| 06/09/2025 06/09/25 | Sold | $135,000 | 0.0% | $165 / Sq Ft | |
| 06/09/2025 06/09/25 | Pending | -- | -- | -- | |
| 06/09/2025 06/09/25 | For Sale | $135,000 | +17.4% | $165 / Sq Ft | |
| 12/09/2022 12/09/22 | Sold | $115,000 | -4.2% | $141 / Sq Ft | View Prior Sale |
| 11/05/2022 11/05/22 | Pending | -- | -- | -- | |
| 11/03/2022 11/03/22 | Price Changed | $120,000 | +300.0% | $147 / Sq Ft | |
| 10/25/2022 10/25/22 | For Sale | $30,000 | -76.0% | $37 / Sq Ft | |
| 10/19/2022 10/19/22 | For Sale | $125,000 | +216.3% | $153 / Sq Ft | |
| 06/30/2022 06/30/22 | Sold | $39,525 | -- | $48 / Sq Ft | View Prior Sale |
| Year | Tax Paid | Tax Assessment Tax Assessment Total Assessment is a certain percentage of the fair market value that is determined by local assessors to be the total taxable value of land and additions on the property. | Land | Improvement |
|---|---|---|---|---|
| 2025 | $1,840 | $120,300 | $21,900 | $98,400 |
| 2024 | $219 | $113,900 | $19,700 | $94,200 |
| 2023 | $219 | $104,000 | $19,700 | $84,300 |
| 2022 | $697 | $77,500 | $17,500 | $60,000 |
| 2021 | $1,328 | $71,200 | $17,500 | $53,700 |
| 2020 | $1,288 | $68,800 | $15,300 | $53,500 |
| 2019 | $1,238 | $66,000 | $15,300 | $50,700 |
| 2018 | $1,200 | $66,000 | $15,300 | $50,700 |
| 2017 | $1,200 | $64,700 | $15,300 | $49,400 |
| 2016 | $1,335 | $62,800 | $15,300 | $47,500 |
| 2015 | $1,371 | $64,445 | $15,330 | $49,115 |
| 2014 | $1,186 | $64,445 | $15,330 | $49,115 |
| 2013 | $1,156 | $64,445 | $15,330 | $49,115 |
U
Seller's Agent in 2025
Unrepresented Seller
Unrepresented Seller

Buyer's Agent in 2025
Rachel Koth
Keller Williams Legacy Group
(319) 651-1963
10 in this area
346 Total Sales
N
Seller's Agent in 2022
Nonmember NONMEMBER
NONMEMBER
J
Seller's Agent in 2022
Jenna Burt-Top Tier Home Team
Keller Williams Legacy Group
(319) 310-9840
13 in this area
301 Total Sales
Buyer's Agent in 2022
Tessa Grimm
Pinnacle Realty LLC
(319) 521-1991
13 in this area
151 Total Sales
Source: Iowa City Area Association of REALTORS®
MLS Number: 202503797
APN: 14334-29003-00000
Disclaimer: Certain information contained herein is derived from information provided by parties other than Homes.com. All information provided is deemed reliable, but is not guaranteed to be accurate and should be independently verified.
![]() IDX information is provided exclusively for consumers’ personal, non-commercial use, that it may not be used for any purpose other than to identify prospective properties consumers may be interested in purchasing.
IDX information is provided exclusively for consumers’ personal, non-commercial use, that it may not be used for any purpose other than to identify prospective properties consumers may be interested in purchasing.
Listing information is deemed reliable, but not guaranteed accurate by the MLS.