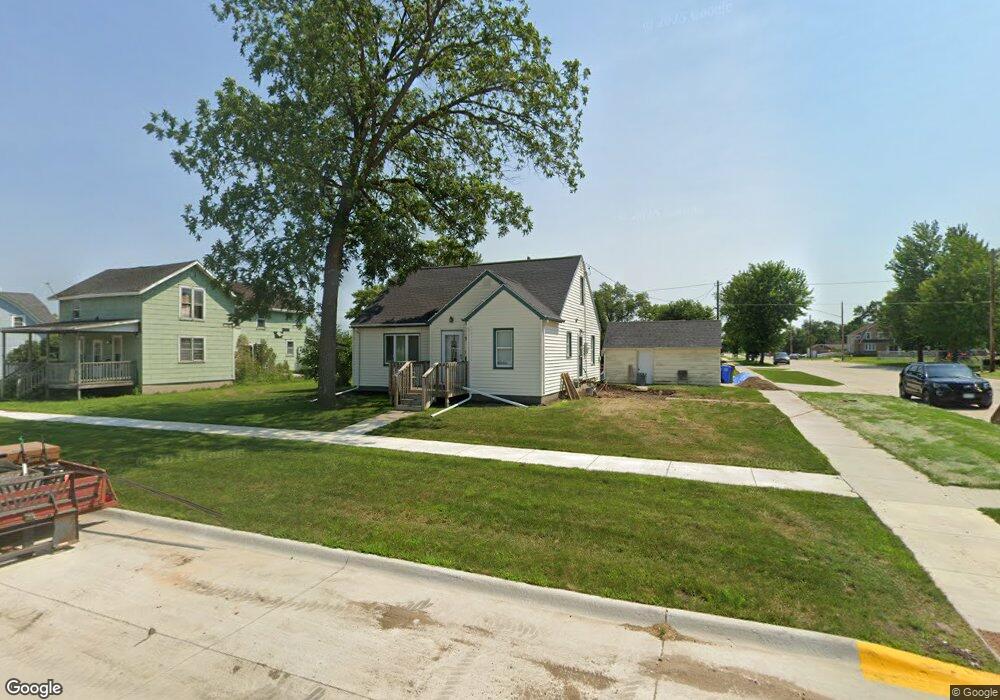
123 6th Ave SE Pipestone, MN 56164
Estimated Value: $103,000 - $145,000
3
Beds
2
Baths
2,212
Sq Ft
$56/Sq Ft
Est. Value
About This Home
This home is located at 123 6th Ave SE, Pipestone, MN 56164 and is currently estimated at $123,500, approximately $55 per square foot. 123 6th Ave SE is a home located in Pipestone County with nearby schools including Brown Elementary School, Pipestone Elementary School, and Pipestone Head Start.
Ownership History
Date
Name
Owned For
Owner Type
Purchase Details
Closed on
Nov 11, 2020
Sold by
Freedom Mortgage Corp
Bought by
Schnoor Matthew Thayne
Current Estimated Value
Purchase Details
Closed on
May 8, 2018
Sold by
Stack Audrey
Bought by
Calderon Juan
Purchase Details
Closed on
Sep 14, 2016
Bought by
Stack Audrey Audrey
Create a Home Valuation Report for This Property
The Home Valuation Report is an in-depth analysis detailing your home's value as well as a comparison with similar homes in the area
Home Values in the Area
Average Home Value in this Area
Purchase History
| Date | Buyer | Sale Price | Title Company |
|---|---|---|---|
| Schnoor Matthew Thayne | $62,000 | None Available | |
| Calderon Juan | $84,976 | Pipestone Abstract & Title C | |
| Stack Audrey Audrey | $21,600 | -- | |
| Stack Audrey | $21,600 | None Available | |
| Schnoor Matthew Matthew | $62,000 | -- |
Source: Public Records
Tax History
| Year | Tax Paid | Tax Assessment Tax Assessment Total Assessment is a certain percentage of the fair market value that is determined by local assessors to be the total taxable value of land and additions on the property. | Land | Improvement |
|---|---|---|---|---|
| 2025 | $2,436 | $97,800 | $10,300 | $87,500 |
| 2024 | $2,436 | $101,300 | $10,300 | $91,000 |
| 2023 | $2,306 | $94,600 | $10,300 | $84,300 |
| 2022 | $1,296 | $78,200 | $7,400 | $70,800 |
| 2021 | $1,324 | $67,700 | $7,400 | $60,300 |
| 2020 | $1,250 | $68,400 | $7,400 | $61,000 |
| 2019 | $1,220 | $72,600 | $5,900 | $66,700 |
| 2018 | $1,198 | $70,900 | $5,900 | $65,000 |
| 2017 | $1,092 | $64,900 | $5,900 | $59,000 |
| 2016 | $1,110 | $0 | $0 | $0 |
| 2015 | $752 | $37,900 | $3,183 | $34,717 |
| 2014 | $752 | $38,000 | $3,182 | $34,818 |
Source: Public Records
Map
Nearby Homes
- 109 5th Ave SE
- 321 5th Ave SE
- 702 4th St SE
- 201 10th Ave SE
- 607 4th Ave SE
- 102 3rd St SE
- 612 7th St NE Unit 6
- 219 3rd Ave SW
- 801 6th Ave SE
- 804 6th Ave SE
- 320 2nd St SW
- 320 2nd St NW
- 807 7th Ave SE
- 804 9th St NE
- 831 4th Ave SW
- 919 3rd Ave SW
- 910 3rd Ave SW
- 106 8th Ave NW
- 106 8th Ave SW
- 604 7th Ave SW
Your Personal Tour Guide
Ask me questions while you tour the home.