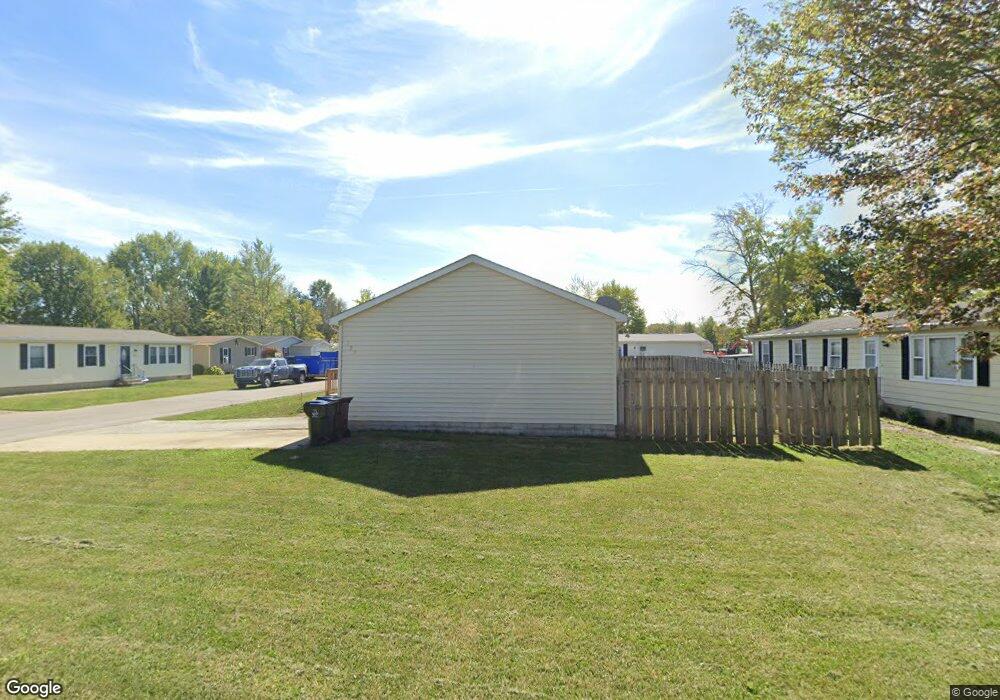
123 Anglers Ln Lagrange, OH 44050
Estimated Value: $128,000 - $190,000
3
Beds
1
Bath
1,075
Sq Ft
$142/Sq Ft
Est. Value
About This Home
This home is located at 123 Anglers Ln, Lagrange, OH 44050 and is currently estimated at $153,166, approximately $142 per square foot. 123 Anglers Ln is a home located in Lorain County with nearby schools including Keystone Elementary School, Keystone Middle School, and Keystone High School.
Ownership History
Date
Name
Owned For
Owner Type
Purchase Details
Closed on
Apr 5, 2001
Sold by
Opperman Christina M and Torok Michael
Bought by
Torok Christina M
Current Estimated Value
Home Financials for this Owner
Home Financials are based on the most recent Mortgage that was taken out on this home.
Original Mortgage
$34,700
Interest Rate
7.13%
Mortgage Type
Stand Alone Second
Purchase Details
Closed on
Jul 28, 1997
Sold by
City Loan Financial Serv
Bought by
Opperman Christina M
Home Financials for this Owner
Home Financials are based on the most recent Mortgage that was taken out on this home.
Original Mortgage
$55,100
Outstanding Balance
$8,456
Interest Rate
7.81%
Mortgage Type
New Conventional
Estimated Equity
$144,710
Purchase Details
Closed on
May 15, 1997
Sold by
Pr Raymond V Rosenberry
Bought by
City Loan Financial Services Inc
Create a Home Valuation Report for This Property
The Home Valuation Report is an in-depth analysis detailing your home's value as well as a comparison with similar homes in the area
Home Values in the Area
Average Home Value in this Area
Purchase History
| Date | Buyer | Sale Price | Title Company |
|---|---|---|---|
| Torok Christina M | -- | Titleco Title Agency | |
| Opperman Christina M | $58,000 | -- | |
| City Loan Financial Services Inc | $39,000 | -- |
Source: Public Records
Mortgage History
| Date | Status | Borrower | Loan Amount |
|---|---|---|---|
| Closed | Torok Christina M | $34,700 | |
| Open | Opperman Christina M | $55,100 |
Source: Public Records
Tax History Compared to Growth
Tax History
| Year | Tax Paid | Tax Assessment Tax Assessment Total Assessment is a certain percentage of the fair market value that is determined by local assessors to be the total taxable value of land and additions on the property. | Land | Improvement |
|---|---|---|---|---|
| 2024 | $3,071 | $36,348 | $6,689 | $29,659 |
| 2023 | $2,992 | $33,639 | $6,787 | $26,852 |
| 2022 | $2,600 | $33,639 | $6,787 | $26,852 |
| 2021 | $2,411 | $33,639 | $6,787 | $26,852 |
| 2020 | $1,875 | $28,410 | $5,730 | $22,680 |
| 2019 | $1,871 | $28,410 | $5,730 | $22,680 |
| 2018 | $1,523 | $28,410 | $5,730 | $22,680 |
| 2017 | $1,444 | $25,230 | $4,020 | $21,210 |
| 2016 | $1,434 | $25,230 | $4,020 | $21,210 |
| 2015 | $1,431 | $25,230 | $4,020 | $21,210 |
| 2014 | $1,241 | $24,020 | $3,820 | $20,200 |
| 2013 | $1,145 | $24,020 | $3,820 | $20,200 |
Source: Public Records
Map
Nearby Homes
- 131 Walleye Ct
- 364 Hickory Run
- 403 Palomino Ct
- 441 Morgan Ct
- 468 Stallion Ct
- 511 Arabian Ct
- 17225 Fairway Dr
- 510 Arabian Ct
- 19045 Whitehead Rd
- 0 West Rd Unit 5125531
- 43311 Peck Wadsworth Rd
- 110 - 122 Railroad St
- 110 Railroad St
- 224 W Main St
- 21690 State Route 301
- 194 Railroad St
- 302 N Center St
- 16974 Hawley Rd
- 171 Keywood Blvd
- 43983 State Route 18