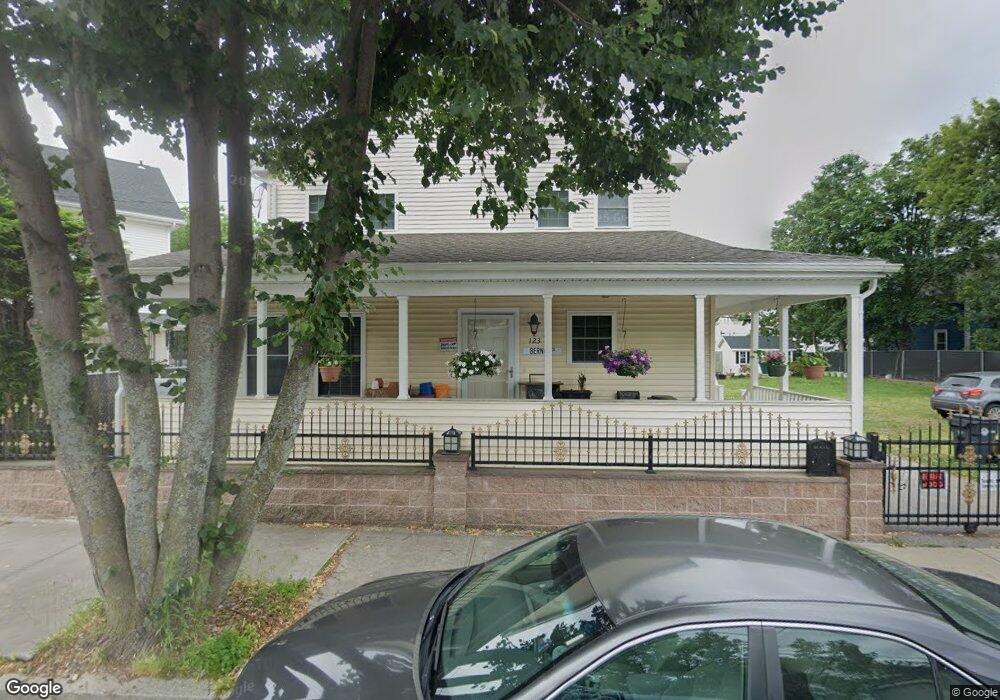
123 Bernon St Providence, RI 02908
Smith Hill NeighborhoodEstimated Value: $622,000 - $789,000
5
Beds
2
Baths
2,359
Sq Ft
$296/Sq Ft
Est. Value
About This Home
This home is located at 123 Bernon St, Providence, RI 02908 and is currently estimated at $699,163, approximately $296 per square foot. 123 Bernon St is a home located in Providence County with nearby schools including Asa Messer Elementary School, Charles N. Fortes Elementary School, and Veazie Street Elementary School.
Ownership History
Date
Name
Owned For
Owner Type
Purchase Details
Closed on
Sep 15, 2004
Sold by
Molina Maria M
Bought by
Mcmahon Craig S
Current Estimated Value
Home Financials for this Owner
Home Financials are based on the most recent Mortgage that was taken out on this home.
Original Mortgage
$157,500
Outstanding Balance
$77,873
Interest Rate
5.85%
Estimated Equity
$621,290
Purchase Details
Closed on
Jul 11, 1994
Sold by
Northeast Svgs
Bought by
Mendrano Oscar
Create a Home Valuation Report for This Property
The Home Valuation Report is an in-depth analysis detailing your home's value as well as a comparison with similar homes in the area
Home Values in the Area
Average Home Value in this Area
Purchase History
| Date | Buyer | Sale Price | Title Company |
|---|---|---|---|
| Mcmahon Craig S | $124,000 | -- | |
| Mendrano Oscar | $72,000 | -- |
Source: Public Records
Mortgage History
| Date | Status | Borrower | Loan Amount |
|---|---|---|---|
| Open | Mendrano Oscar | $157,500 | |
| Previous Owner | Mendrano Oscar | $140,000 | |
| Previous Owner | Mendrano Oscar | $75,500 |
Source: Public Records
Tax History Compared to Growth
Tax History
| Year | Tax Paid | Tax Assessment Tax Assessment Total Assessment is a certain percentage of the fair market value that is determined by local assessors to be the total taxable value of land and additions on the property. | Land | Improvement |
|---|---|---|---|---|
| 2025 | $4,957 | $656,500 | $147,600 | $508,900 |
| 2024 | $8,131 | $443,100 | $69,700 | $373,400 |
| 2023 | $8,131 | $443,100 | $69,700 | $373,400 |
| 2022 | $7,268 | $408,300 | $34,900 | $373,400 |
| 2021 | $6,666 | $271,400 | $18,200 | $253,200 |
| 2020 | $6,666 | $271,400 | $18,200 | $253,200 |
| 2019 | $6,666 | $271,400 | $18,200 | $253,200 |
| 2018 | $5,622 | $175,900 | $19,500 | $156,400 |
| 2017 | $5,622 | $175,900 | $19,500 | $156,400 |
| 2016 | $5,622 | $175,900 | $19,500 | $156,400 |
| 2015 | $847 | $25,600 | $25,600 | $0 |
| 2014 | $864 | $25,600 | $25,600 | $0 |
| 2013 | $2,710 | $80,300 | $51,100 | $29,200 |
Source: Public Records
Map
Nearby Homes
- 508 Chalkstone Ave
- 510 Chalkstone Ave
- 316 Orms St
- 17 Alma St
- 160 Jewett St
- 15 Crimea St
- 18 Winsor St
- 18 Whipple St
- 42 Derry St
- 65 Douglas Ave
- 39 Richter St
- 23 Richter St
- 331 Douglas Ave
- 154 Camden Ave
- 50 Ashburton St Unit 14
- 50 Ashburton St Unit 23
- 94 Garfield Ave
- 22 Suffolk St
- 1000 Providence Place Unit 234
- 1000 Providence Place Unit 120
- 43 Nolan St
- 119 Bernon St
- 47 Nolan St
- 47 Nolan St Unit 2
- 100 Wayne St
- 107 Wayne St
- 107 Bernon St
- 118 Bernon St
- 118 Bernon St Unit 2
- 51 Nolan St
- 51 Nolan St Unit 3
- 48 Nolan St
- 371 Smith St
- 112 Bernon St
- 516 Chalkstone Ave
- 516 Chalkstone Ave Unit Lower Level
- 516 Chalkstone Ave Unit 1st Flr
- 123 Wayne St
- 103 Bernon St
- 365 Smith St