123 Borough Rd Concord, NH 03303
Penacook NeighborhoodEstimated Value: $355,134 - $392,000
2
Beds
1
Bath
1,098
Sq Ft
$342/Sq Ft
Est. Value
About This Home
This home is located at 123 Borough Rd, Concord, NH 03303 and is currently estimated at $375,034, approximately $341 per square foot. 123 Borough Rd is a home located in Merrimack County with nearby schools including Penacook Elementary School, Merrimack Valley Middle School, and Merrimack Valley High School.
Ownership History
Date
Name
Owned For
Owner Type
Purchase Details
Closed on
Sep 9, 2021
Sold by
Greenwood Lori J and Greenwood Louis J
Bought by
Greenwood Lori J and Greenwood Louis J
Current Estimated Value
Home Financials for this Owner
Home Financials are based on the most recent Mortgage that was taken out on this home.
Original Mortgage
$142,200
Outstanding Balance
$120,436
Interest Rate
2.7%
Mortgage Type
Stand Alone Refi Refinance Of Original Loan
Estimated Equity
$254,598
Purchase Details
Closed on
Nov 30, 2005
Sold by
Polissack Lisa M
Bought by
Greenwood Louis J
Home Financials for this Owner
Home Financials are based on the most recent Mortgage that was taken out on this home.
Original Mortgage
$128,000
Interest Rate
6.14%
Mortgage Type
Purchase Money Mortgage
Create a Home Valuation Report for This Property
The Home Valuation Report is an in-depth analysis detailing your home's value as well as a comparison with similar homes in the area
Home Values in the Area
Average Home Value in this Area
Purchase History
| Date | Buyer | Sale Price | Title Company |
|---|---|---|---|
| Greenwood Lori J | -- | None Available | |
| Greenwood Lori J | -- | None Available | |
| Greenwood Louis J | $160,000 | -- | |
| Greenwood Louis J | $160,000 | -- | |
| Greenwood Louis J | $160,000 | -- |
Source: Public Records
Mortgage History
| Date | Status | Borrower | Loan Amount |
|---|---|---|---|
| Open | Greenwood Lori J | $142,200 | |
| Previous Owner | Greenwood Louis J | $164,000 | |
| Previous Owner | Greenwood Louis J | $172,311 | |
| Previous Owner | Greenwood Louis J | $128,000 |
Source: Public Records
Tax History
| Year | Tax Paid | Tax Assessment Tax Assessment Total Assessment is a certain percentage of the fair market value that is determined by local assessors to be the total taxable value of land and additions on the property. | Land | Improvement |
|---|---|---|---|---|
| 2025 | $6,102 | $198,500 | $97,100 | $101,400 |
| 2024 | $6,082 | $198,500 | $97,100 | $101,400 |
| 2023 | $5,786 | $198,500 | $97,100 | $101,400 |
| 2022 | $5,782 | $198,500 | $97,100 | $101,400 |
| 2021 | $5,493 | $196,400 | $97,100 | $99,300 |
| 2020 | $5,064 | $169,200 | $74,400 | $94,800 |
| 2019 | $5,248 | $153,900 | $72,000 | $81,900 |
| 2018 | $5,117 | $152,300 | $72,000 | $80,300 |
| 2017 | $4,878 | $143,800 | $68,200 | $75,600 |
| 2016 | $3,813 | $137,800 | $66,300 | $71,500 |
| 2015 | $4,371 | $129,000 | $66,300 | $62,700 |
| 2014 | $4,178 | $129,000 | $66,300 | $62,700 |
| 2013 | -- | $127,300 | $66,300 | $61,000 |
| 2012 | -- | $127,200 | $66,300 | $60,900 |
Source: Public Records
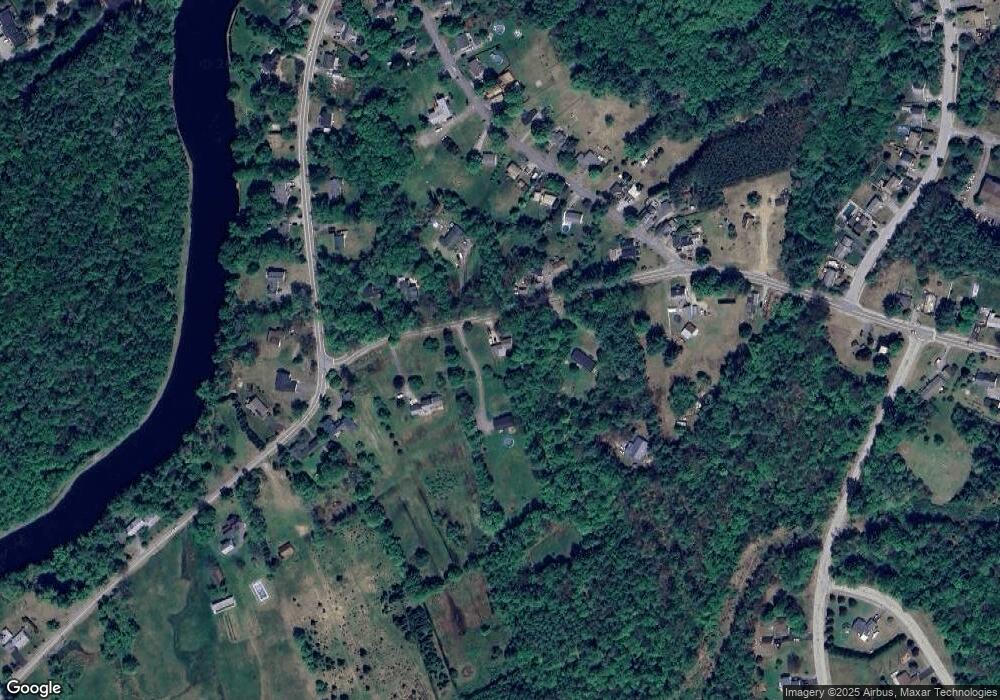
Map
Nearby Homes
- 68 Great Falls Dr
- 26 Whitewater Dr Unit 21
- 42 Modena Dr
- 25 Island Rd
- 13 Suffolk Dr Unit 3
- 271 Village St Unit 273
- 5 Bonney St
- 291 Village St Unit 297
- 9 Amy Way
- 12 Cross St Unit 201
- 00 Elm St Unit 1
- 26 Crescent St
- 37 Alice Dr Unit 129
- 37 Alice Dr Unit 75
- 25 Cheryl Dr
- 13 Suffolk Rd Unit 5
- 13 Suffolk Rd Unit 4
- 13 Suffolk Rd Unit 8
- 18 Dawn Dr
- 14 Cheryl Dr
Your Personal Tour Guide
Ask me questions while you tour the home.