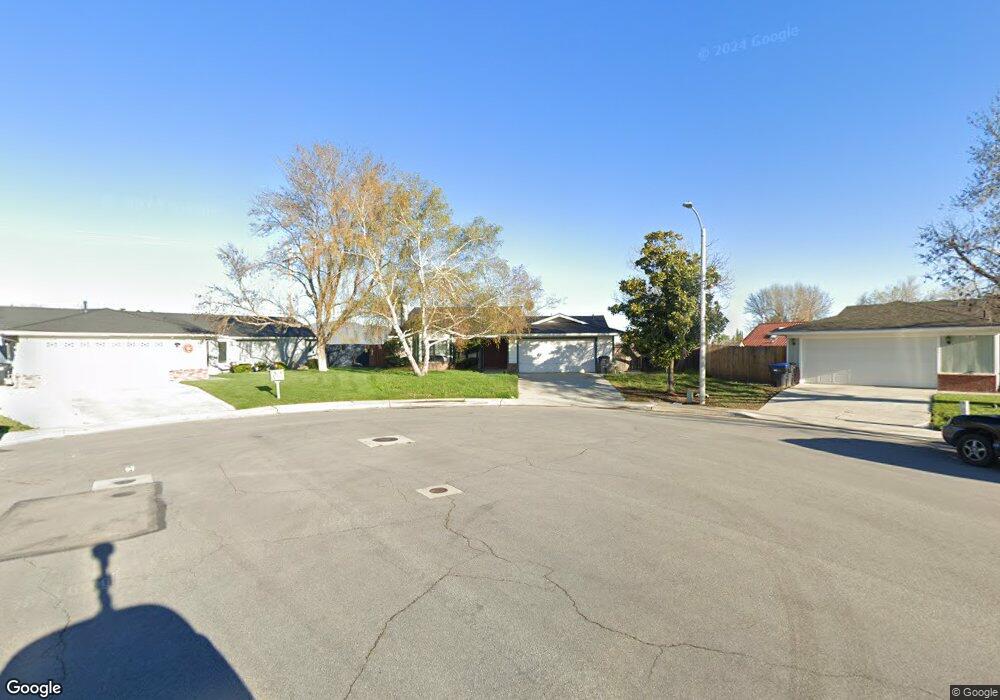
123 Chaparrel St Unit A Tehachapi, CA 93561
Estimated Value: $368,000 - $431,000
3
Beds
2
Baths
1,551
Sq Ft
$256/Sq Ft
Est. Value
About This Home
This home is located at 123 Chaparrel St Unit A, Tehachapi, CA 93561 and is currently estimated at $397,431, approximately $256 per square foot. 123 Chaparrel St Unit A is a home located in Kern County with nearby schools including Tompkins Elementary School, Jacobsen Middle School, and Tehachapi High School.
Ownership History
Date
Name
Owned For
Owner Type
Purchase Details
Closed on
Mar 30, 2005
Sold by
Salzer Sunny S
Bought by
Salzer Sunny S and The Sunny Salzer Trust
Current Estimated Value
Purchase Details
Closed on
Nov 5, 2004
Sold by
Heim Linda
Bought by
Salzer Sunny S
Home Financials for this Owner
Home Financials are based on the most recent Mortgage that was taken out on this home.
Original Mortgage
$166,875
Outstanding Balance
$72,924
Interest Rate
3.94%
Mortgage Type
Negative Amortization
Estimated Equity
$324,507
Purchase Details
Closed on
Sep 19, 2001
Sold by
Heim Linda M and Heim Berard Linda Mary
Bought by
Heim Linda
Home Financials for this Owner
Home Financials are based on the most recent Mortgage that was taken out on this home.
Original Mortgage
$77,000
Interest Rate
6.87%
Purchase Details
Closed on
Mar 28, 1998
Sold by
Berard Michael G
Bought by
Heim Berard Linda Mary
Create a Home Valuation Report for This Property
The Home Valuation Report is an in-depth analysis detailing your home's value as well as a comparison with similar homes in the area
Home Values in the Area
Average Home Value in this Area
Purchase History
| Date | Buyer | Sale Price | Title Company |
|---|---|---|---|
| Salzer Sunny S | -- | None Available | |
| Salzer Sunny S | $222,500 | Chicago Title | |
| Heim Linda | -- | Chicago Title Co | |
| Heim Berard Linda Mary | -- | -- |
Source: Public Records
Mortgage History
| Date | Status | Borrower | Loan Amount |
|---|---|---|---|
| Open | Salzer Sunny S | $166,875 | |
| Previous Owner | Heim Linda | $77,000 |
Source: Public Records
Tax History
| Year | Tax Paid | Tax Assessment Tax Assessment Total Assessment is a certain percentage of the fair market value that is determined by local assessors to be the total taxable value of land and additions on the property. | Land | Improvement |
|---|---|---|---|---|
| 2025 | $3,712 | $310,128 | $39,021 | $271,107 |
| 2024 | $3,580 | $304,048 | $38,256 | $265,792 |
| 2023 | $3,580 | $298,087 | $37,506 | $260,581 |
| 2022 | $3,546 | $292,243 | $36,771 | $255,472 |
| 2021 | $3,515 | $286,513 | $36,050 | $250,463 |
| 2020 | $3,268 | $262,000 | $66,000 | $196,000 |
| 2019 | $3,120 | $245,000 | $61,000 | $184,000 |
| 2018 | $2,849 | $227,000 | $57,000 | $170,000 |
| 2017 | $2,727 | $213,000 | $53,000 | $160,000 |
| 2016 | $2,423 | $190,000 | $48,000 | $142,000 |
| 2015 | $2,256 | $183,000 | $46,000 | $137,000 |
| 2014 | $2,012 | $161,000 | $40,000 | $121,000 |
Source: Public Records
Map
Nearby Homes
- 114 Chaparrel St
- 0 Pinon St
- 210 Pinon St Unit 11
- 210 Pinon St Unit 18
- 210 Pinon St Unit 4
- 210 Pinon St Unit 1
- 210 Pinon St Unit 6
- 210 Pinon St Unit 15
- 210 Pinon St Unit 5
- 210 Pinon St Unit 9
- 210 Pinon St Unit 7
- 210 Pinon St Unit 13
- 210 Pinon St Unit 8
- 210 Pinon St Unit 3
- 210 Pinon St Unit 16
- 210 Pinon St Unit 19
- 210 Pinon St Unit 10
- 210 Pinon St Unit 12
- 210 Pinon St Unit 14
- 210 Pinon St Unit 17
- 121 Chaparrel St
- 125 Chaparrel St
- 1201 S Curry St
- 1200 S Curry St
- 119 Chaparrel St
- 122 Chaparrel St
- 120 Chaparrel St
- 117 Chaparrel St
- 118 Chaparrel St
- 28603 Summit Rd Tehachapi Rd
- 203 Meadowbrook Ct
- 115 Chaparrel St
- 125 Sunrise Way
- 123 Sunrise Way
- 116 Chaparrel St
- 205 Meadowbrook Ct
- 200 Meadowbrook Ct
- 121 Sunrise Way
- 119 Sunrise Way
- 113 Chaparrel St
Your Personal Tour Guide
Ask me questions while you tour the home.