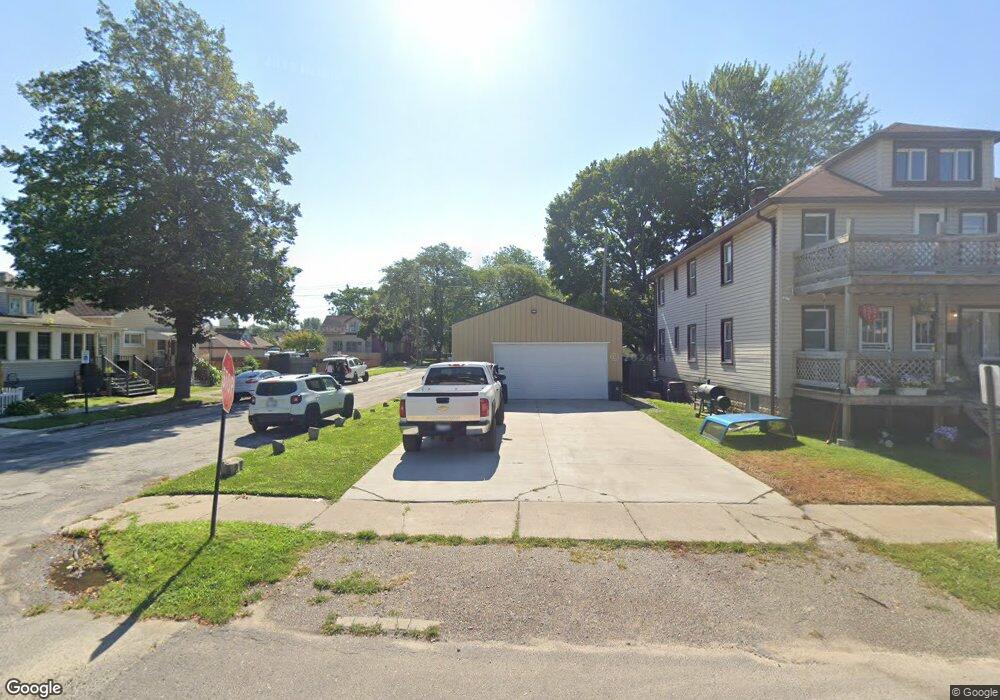
123 Charles St River Rouge, MI 48218
Estimated Value: $80,000 - $106,000
3
Beds
1
Bath
1,280
Sq Ft
$75/Sq Ft
Est. Value
About This Home
This home is located at 123 Charles St, River Rouge, MI 48218 and is currently estimated at $95,996, approximately $74 per square foot. 123 Charles St is a home located in Wayne County with nearby schools including Ann Visger K-5 Preparatory Academy.
Ownership History
Date
Name
Owned For
Owner Type
Purchase Details
Closed on
Oct 15, 2019
Sold by
Wayne County Land Bank Corporation
Bought by
Culbreth Robert and Culbreth Cynthia
Current Estimated Value
Purchase Details
Closed on
Mar 30, 2017
Sold by
Sabree Eric R
Bought by
Wayne County Land Bank
Purchase Details
Closed on
Mar 16, 2017
Sold by
City Of River Rouge
Bought by
Wayne County Treasurer Of The Charter Co
Purchase Details
Closed on
Feb 20, 2017
Sold by
Sabree Eric R
Bought by
Treasurer City Of River Rouge
Purchase Details
Closed on
Jan 23, 2013
Sold by
Wayne County Treasurer
Bought by
Treasurer City Of River Rouge
Purchase Details
Closed on
May 16, 2008
Sold by
Salvaggio Gasper
Bought by
Gray April
Purchase Details
Closed on
Apr 5, 2007
Sold by
Fannie Mae
Bought by
Salvaggio Gasper
Purchase Details
Closed on
Jan 20, 2006
Sold by
Mortgage Electronic Registration Systems
Bought by
Federal National Mortgage Association
Create a Home Valuation Report for This Property
The Home Valuation Report is an in-depth analysis detailing your home's value as well as a comparison with similar homes in the area
Home Values in the Area
Average Home Value in this Area
Purchase History
| Date | Buyer | Sale Price | Title Company |
|---|---|---|---|
| Culbreth Robert | $250 | None Available | |
| Wayne County Land Bank | -- | None Available | |
| Wayne County Treasurer Of The Charter Co | -- | None Available | |
| Treasurer City Of River Rouge | -- | None Available | |
| Treasurer City Of River Rouge | -- | None Available | |
| Gray April | -- | Abstract Title Agency | |
| Salvaggio Gasper | $7,250 | Greco | |
| Federal National Mortgage Association | -- | None Available |
Source: Public Records
Tax History Compared to Growth
Tax History
| Year | Tax Paid | Tax Assessment Tax Assessment Total Assessment is a certain percentage of the fair market value that is determined by local assessors to be the total taxable value of land and additions on the property. | Land | Improvement |
|---|---|---|---|---|
| 2025 | $275 | $7,700 | $0 | $0 |
| 2024 | $275 | $6,600 | $0 | $0 |
| 2023 | $262 | $5,100 | $0 | $0 |
| 2022 | $365 | $4,200 | $0 | $0 |
| 2021 | $353 | $3,600 | $0 | $0 |
| 2020 | $133 | $1,300 | $0 | $0 |
| 2019 | $0 | $0 | $0 | $0 |
| 2018 | $0 | $0 | $0 | $0 |
| 2017 | $0 | $0 | $0 | $0 |
| 2016 | $0 | $0 | $0 | $0 |
| 2015 | $2,340 | $0 | $0 | $0 |
| 2013 | $2,340 | $23,400 | $0 | $0 |
| 2012 | $563 | $22,800 | $2,800 | $20,000 |
Source: Public Records
Map
Nearby Homes