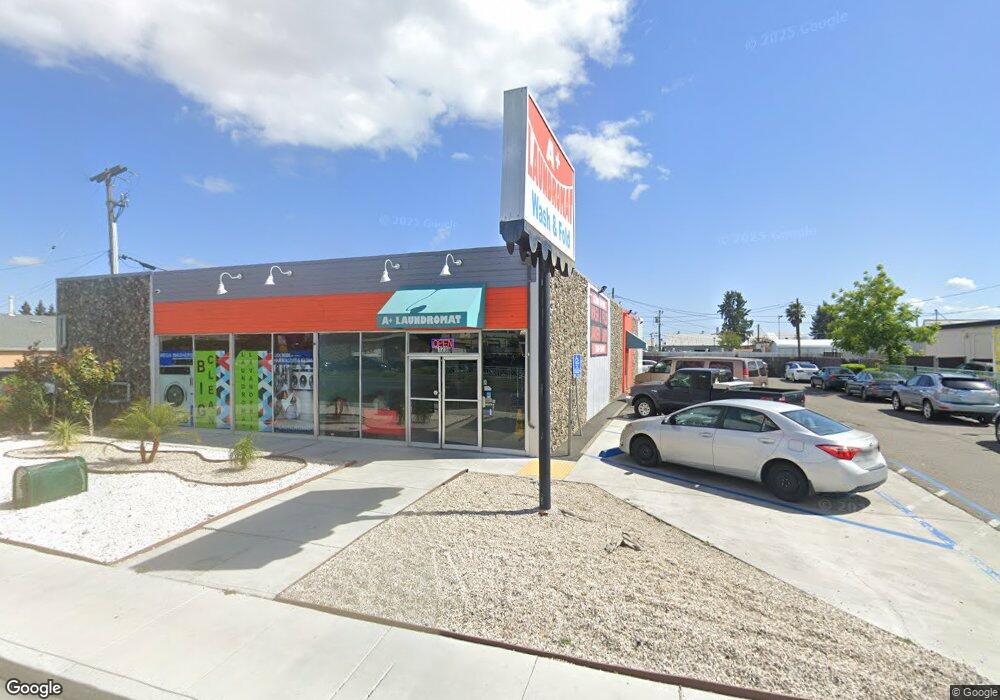
123 E Travis Blvd Fairfield, CA 94533
Estimated Value: $1,224,242
Studio
--
Bath
5,720
Sq Ft
$214/Sq Ft
Est. Value
About This Home
This home is located at 123 E Travis Blvd, Fairfield, CA 94533 and is currently estimated at $1,224,242, approximately $214 per square foot. 123 E Travis Blvd is a home located in Solano County with nearby schools including Anna Kyle Elementary School, Grange Middle School, and Armijo High School.
Ownership History
Date
Name
Owned For
Owner Type
Purchase Details
Closed on
Jun 29, 2021
Sold by
Krc Properties Plus Llc
Bought by
Bank Of Hope
Current Estimated Value
Home Financials for this Owner
Home Financials are based on the most recent Mortgage that was taken out on this home.
Original Mortgage
$945,000
Outstanding Balance
$855,580
Interest Rate
2.9%
Mortgage Type
Small Business Administration
Estimated Equity
$353,796
Purchase Details
Closed on
Jun 16, 2021
Sold by
Nor Cal Properties Management Llc
Bought by
Krc Properties Plus Llc
Home Financials for this Owner
Home Financials are based on the most recent Mortgage that was taken out on this home.
Original Mortgage
$945,000
Outstanding Balance
$855,580
Interest Rate
2.9%
Mortgage Type
Small Business Administration
Estimated Equity
$353,796
Purchase Details
Closed on
Dec 23, 2019
Sold by
Darling Heidi and The Preston Family Trust
Bought by
Nor Cal Property Management Llc
Create a Home Valuation Report for This Property
The Home Valuation Report is an in-depth analysis detailing your home's value as well as a comparison with similar homes in the area
Home Values in the Area
Average Home Value in this Area
Purchase History
| Date | Buyer | Sale Price | Title Company |
|---|---|---|---|
| Bank Of Hope | -- | Fidelity National Title | |
| Krc Properties Plus Llc | $1,140,000 | Fidelity National Title Co | |
| Nor Cal Property Management Llc | $460,000 | Fidelity National Title Co |
Source: Public Records
Mortgage History
| Date | Status | Borrower | Loan Amount |
|---|---|---|---|
| Open | Krc Properties Plus Llc | $945,000 |
Source: Public Records
Tax History
| Year | Tax Paid | Tax Assessment Tax Assessment Total Assessment is a certain percentage of the fair market value that is determined by local assessors to be the total taxable value of land and additions on the property. | Land | Improvement |
|---|---|---|---|---|
| 2025 | $21,400 | $1,233,971 | $368,026 | $865,945 |
| 2024 | $21,400 | $1,639,776 | $360,810 | $1,278,966 |
| 2023 | $20,976 | $1,186,056 | $353,736 | $832,320 |
| 2022 | $13,243 | $1,162,800 | $346,800 | $816,000 |
| 2021 | $5,421 | $464,765 | $141,450 | $323,315 |
| 2020 | $5,735 | $499,001 | $168,748 | $330,253 |
| 2019 | $5,596 | $489,218 | $165,440 | $323,778 |
| 2018 | $5,774 | $479,627 | $162,197 | $317,430 |
| 2017 | $5,511 | $470,223 | $159,017 | $311,206 |
| 2016 | $3,106 | $257,234 | $106,703 | $150,531 |
| 2015 | $2,906 | $253,371 | $105,101 | $148,270 |
| 2014 | $2,881 | $248,409 | $103,043 | $145,366 |
Source: Public Records
Map
Nearby Homes
- 133 E Travis Blvd
- 1541 Rayburn Ct
- 1667 Vicksburg Dr
- 1652 Glenmore Dr
- 219 Wisconsin St
- 1660 Glenmore Dr
- 1318 Taft St
- 1669 Rutledge Ln
- 1712 Arthur Ct
- 1724 Fillmore St
- 1424 Mckinley St
- 1047 E Tennessee Ct
- 518 Carolina St
- 1812 San Jose Place
- 249 E Tennessee St
- 112 E Kentucky St
- 1845 San Anselmo St
- 1831 Clay St
- 366 San Andreas St
- 120 Railroad Ave
- 139 E Travis Blvd
- 205 E Travis Blvd
- 140 E Travis Blvd
- 219 E Travis Blvd
- 320 E Travis Blvd
- 324 E Travis Blvd Unit 15
- 218 E Wyoming St
- 221 E Travis Blvd
- 328 E Travis Blvd Unit 14
- 224 E Wyoming St
- 1609 Vicksburg Dr
- 1609 Vicksburg Dr Unit 17
- 1601 Vicksburg Dr
- 1611 Vicksburg Dr Unit 18
- 230 E Wyoming St
- 1607 Centennial Dr
- 1613 Vicksburg Dr Unit 19
- 1605 Centennial Dr
- 1617 Centennial Dr
- 300 E Wyoming St
Your Personal Tour Guide
Ask me questions while you tour the home.