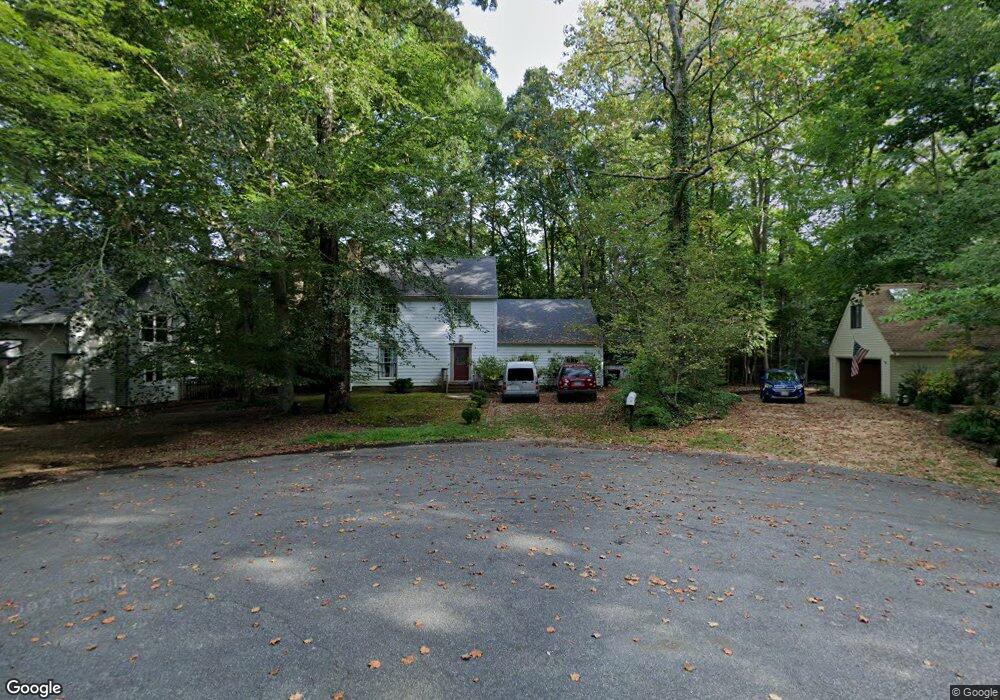
123 Fall E Williamsburg, VA 23188
Centerville NeighborhoodEstimated Value: $386,000 - $439,000
4
Beds
3
Baths
2,285
Sq Ft
$181/Sq Ft
Est. Value
About This Home
This home is located at 123 Fall E, Williamsburg, VA 23188 and is currently estimated at $413,321, approximately $180 per square foot. 123 Fall E is a home located in James City County with nearby schools including D.J. Montague Elementary School, Lois Hornsby Middle School, and Lafayette High School.
Ownership History
Date
Name
Owned For
Owner Type
Purchase Details
Closed on
Nov 7, 2007
Sold by
Bell Edward J
Bought by
Coleman Elizabeth S
Current Estimated Value
Home Financials for this Owner
Home Financials are based on the most recent Mortgage that was taken out on this home.
Original Mortgage
$200,000
Outstanding Balance
$126,162
Interest Rate
6.41%
Mortgage Type
New Conventional
Estimated Equity
$287,159
Purchase Details
Closed on
Nov 3, 2005
Sold by
Paul Mark E
Bought by
Coleman Elizabeth S
Create a Home Valuation Report for This Property
The Home Valuation Report is an in-depth analysis detailing your home's value as well as a comparison with similar homes in the area
Home Values in the Area
Average Home Value in this Area
Purchase History
| Date | Buyer | Sale Price | Title Company |
|---|---|---|---|
| Coleman Elizabeth S | $253,500 | -- | |
| Coleman Elizabeth S | $284,000 | -- |
Source: Public Records
Mortgage History
| Date | Status | Borrower | Loan Amount |
|---|---|---|---|
| Open | Coleman Elizabeth S | $200,000 |
Source: Public Records
Tax History
| Year | Tax Paid | Tax Assessment Tax Assessment Total Assessment is a certain percentage of the fair market value that is determined by local assessors to be the total taxable value of land and additions on the property. | Land | Improvement |
|---|---|---|---|---|
| 2025 | $2,924 | $352,300 | $83,800 | $268,500 |
| 2023 | $2,748 | $273,500 | $61,800 | $211,700 |
| 2022 | $2,270 | $273,500 | $61,800 | $211,700 |
| 2021 | $2,148 | $255,700 | $56,200 | $199,500 |
| 2020 | $2,148 | $255,700 | $56,200 | $199,500 |
| 2019 | $2,148 | $255,700 | $56,200 | $199,500 |
| 2018 | $2,148 | $255,700 | $56,200 | $199,500 |
| 2017 | $1,924 | $229,000 | $56,200 | $172,800 |
| 2016 | $1,924 | $229,000 | $56,200 | $172,800 |
| 2015 | $1,042 | $248,200 | $56,200 | $192,000 |
| 2014 | $1,911 | $248,200 | $56,200 | $192,000 |
Source: Public Records
Map
Nearby Homes
- 533 Spring Trace
- 4 Autumn E
- 12 Autumn E
- 942 Pheasant Run
- 11 Spring W
- 2 Spring W Unit W
- 2 Spring W
- 105 Heron Ct
- 2 Clarendon Ct
- 6216 St Johns Wood
- 5302 Sloane Square
- 5600 Lori Mahone Overlook
- 5361 Ridgewood Hills Dr
- 5333 Ridgewood Hills Dr
- 5341 Ridgewood Hills Dr
- 5353 Ridgewood Hills Dr
- 5329 Ridgewood Hills Dr
- 5337 Ridgewood Hills Dr
- 5349 Ridgewood Hills Dr
- 5357 Ridgewood Hills Dr
Your Personal Tour Guide
Ask me questions while you tour the home.