
Seller's Agent in 2025
Branden Chhuor
Compass
(213) 536-9669
54 Total Sales
Estimated Value: $741,652 - $748,000
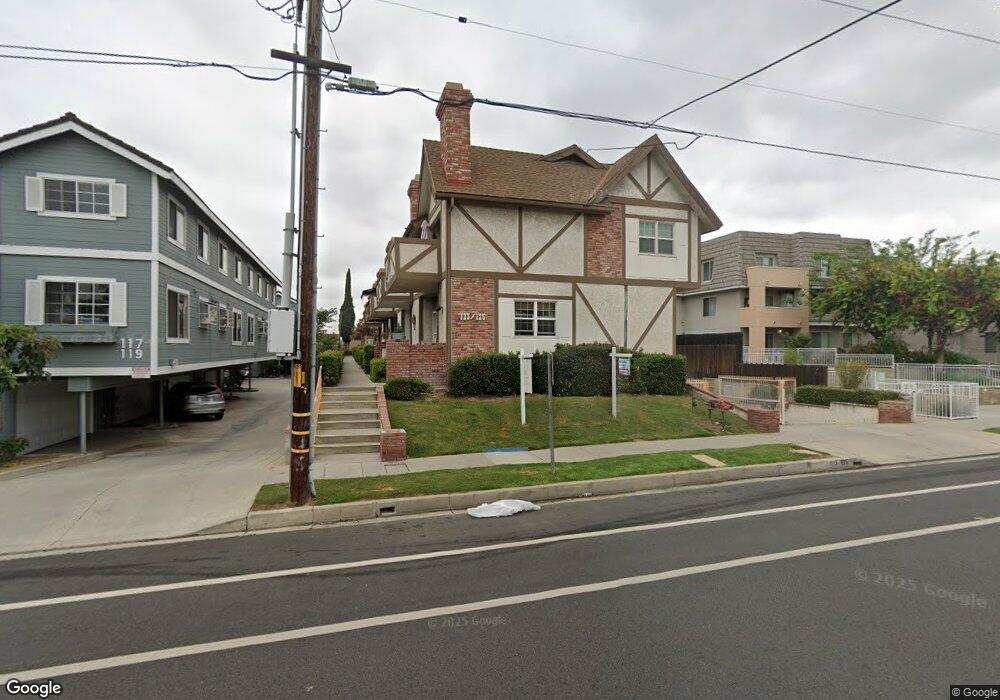
Beautifully remodeled, south-facing townhouse in the heart of Monterey Park and zoned for the highly coveted Mark Keppel High School. This bright 3-bed, 2.5-bath home features a modern open floor plan, new LVP flooring, updated kitchen with quartz counters, new cabinetry, recessed lighting, and a balcony. All bathrooms have been fully renovated with new tile and designer finishes. The primary suite includes a rebuilt private balcony, walk-in closet, and dual-sink vanity. Additional perks: dual-pane windows, fresh paint, and an attached two-car garage. Located in a quiet community with low HOA dues covering water, trash, exterior maintenance, and insurance. Minutes to Garfield’s dining, supermarkets, ELAC, and 10/710 access—this turnkey home is a Monterey Park standout.
| Date | Buyer | Sale Price | Title Company |
|---|---|---|---|
| Quan Benny D | $162,000 | Stewart Title |
| Date | Status | Borrower | Loan Amount |
|---|---|---|---|
| Closed | Quan Benny D | $112,000 |
| Date | Event | Price | List to Sale | Price per Sq Ft |
|---|---|---|---|---|
| 11/21/2025 11/21/25 | Price Changed | $718,888 | -1.4% | $531 / Sq Ft |
| 11/05/2025 11/05/25 | For Sale | $728,888 | -2.8% | $538 / Sq Ft |
| 11/04/2025 11/04/25 | Off Market | $750,000 | -- | -- |
| 10/08/2025 10/08/25 | For Sale | $750,000 | -- | $554 / Sq Ft |
| Year | Tax Paid | Tax Assessment Tax Assessment Total Assessment is a certain percentage of the fair market value that is determined by local assessors to be the total taxable value of land and additions on the property. | Land | Improvement |
|---|---|---|---|---|
| 2025 | $3,634 | $272,081 | $105,300 | $166,781 |
| 2024 | $3,634 | $266,747 | $103,236 | $163,511 |
| 2023 | $3,559 | $261,517 | $101,212 | $160,305 |
| 2022 | $3,394 | $256,390 | $99,228 | $157,162 |
| 2021 | $3,346 | $251,364 | $97,283 | $154,081 |
| 2019 | $3,228 | $243,911 | $94,399 | $149,512 |
| 2018 | $3,216 | $239,130 | $92,549 | $146,581 |
| 2016 | $2,980 | $229,846 | $88,956 | $140,890 |
| 2015 | $2,933 | $226,394 | $87,620 | $138,774 |
| 2014 | $2,895 | $221,960 | $85,904 | $136,056 |
Seller's Agent in 2025
Branden Chhuor
Compass
(213) 536-9669
54 Total Sales