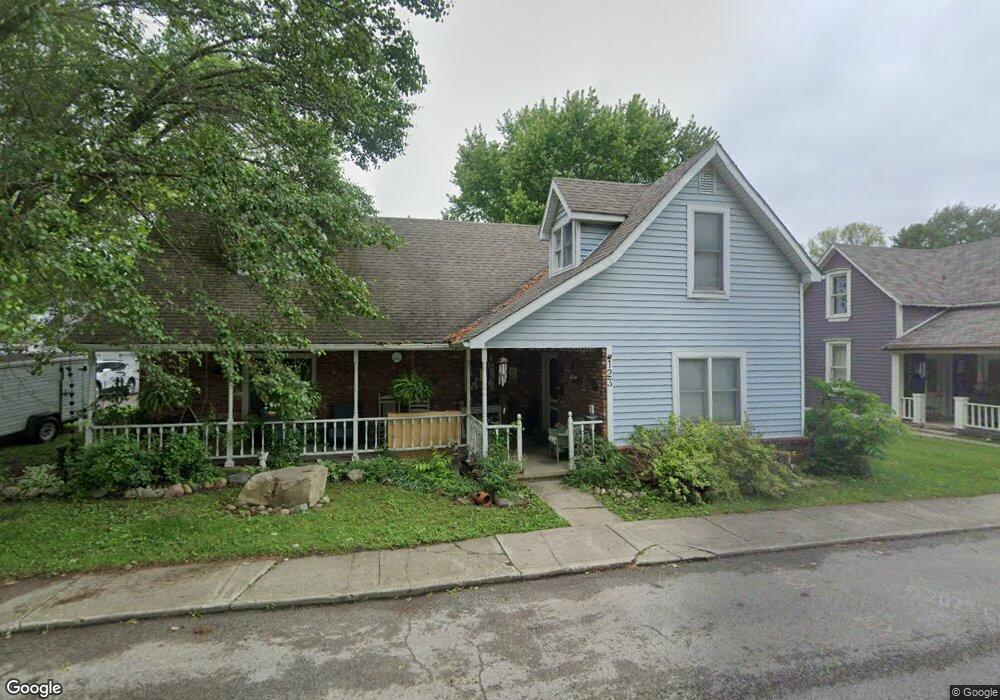
123 N East St Pendleton, IN 46064
Estimated Value: $274,000 - $368,000
3
Beds
2
Baths
2,152
Sq Ft
$141/Sq Ft
Est. Value
About This Home
This home is located at 123 N East St, Pendleton, IN 46064 and is currently estimated at $302,419, approximately $140 per square foot. 123 N East St is a home located in Madison County with nearby schools including St. Ansgar Elementary School, St. Ansgar Middle School, and Pendleton Heights High School.
Ownership History
Date
Name
Owned For
Owner Type
Purchase Details
Closed on
Mar 23, 2024
Sold by
Colip Gregory A
Bought by
Rigdon William D and Rigdon Staci J
Current Estimated Value
Purchase Details
Closed on
Apr 21, 2015
Sold by
Colip Gregory Alex
Bought by
Colip Gregory A
Home Financials for this Owner
Home Financials are based on the most recent Mortgage that was taken out on this home.
Original Mortgage
$40,000
Interest Rate
3.68%
Mortgage Type
Stand Alone First
Create a Home Valuation Report for This Property
The Home Valuation Report is an in-depth analysis detailing your home's value as well as a comparison with similar homes in the area
Home Values in the Area
Average Home Value in this Area
Purchase History
| Date | Buyer | Sale Price | Title Company |
|---|---|---|---|
| Rigdon William D | -- | None Listed On Document | |
| Colip Gregory A | -- | -- |
Source: Public Records
Mortgage History
| Date | Status | Borrower | Loan Amount |
|---|---|---|---|
| Previous Owner | Colip Gregory A | $40,000 |
Source: Public Records
Tax History Compared to Growth
Tax History
| Year | Tax Paid | Tax Assessment Tax Assessment Total Assessment is a certain percentage of the fair market value that is determined by local assessors to be the total taxable value of land and additions on the property. | Land | Improvement |
|---|---|---|---|---|
| 2025 | $1,618 | $162,600 | $27,500 | $135,100 |
| 2024 | $1,618 | $162,600 | $27,500 | $135,100 |
| 2023 | $1,491 | $149,100 | $26,200 | $122,900 |
| 2022 | $1,268 | $132,500 | $25,000 | $107,500 |
| 2021 | $1,146 | $123,600 | $25,000 | $98,600 |
| 2020 | $1,262 | $117,900 | $23,800 | $94,100 |
| 2019 | $1,117 | $115,100 | $23,800 | $91,300 |
| 2018 | $1,027 | $107,500 | $23,800 | $83,700 |
| 2017 | $911 | $98,800 | $22,000 | $76,800 |
| 2016 | $915 | $99,100 | $22,000 | $77,100 |
| 2014 | $898 | $97,600 | $22,000 | $75,600 |
| 2013 | $898 | $97,600 | $22,000 | $75,600 |
Source: Public Records
Map
Nearby Homes
- 235 E Water St
- 1000 East St
- 300 Falls Park Dr
- 110 W Water St
- 315 W High St
- 529 S Main St
- 6972 S 300 W
- 238 Jefferson St
- 275 Linden Ct
- 261 Blue Spruce Dr
- 2916 Market St
- 291 Limerick Ln
- 840 S Broadway St
- 0 W State St
- 159 Carrick Glen Blvd
- 9806 Olympic Blvd
- 9835 Bryce Blvd
- 645 Kilmore Dr
- 9909 Canyon Ln
- 1743 Creek Bed Ln