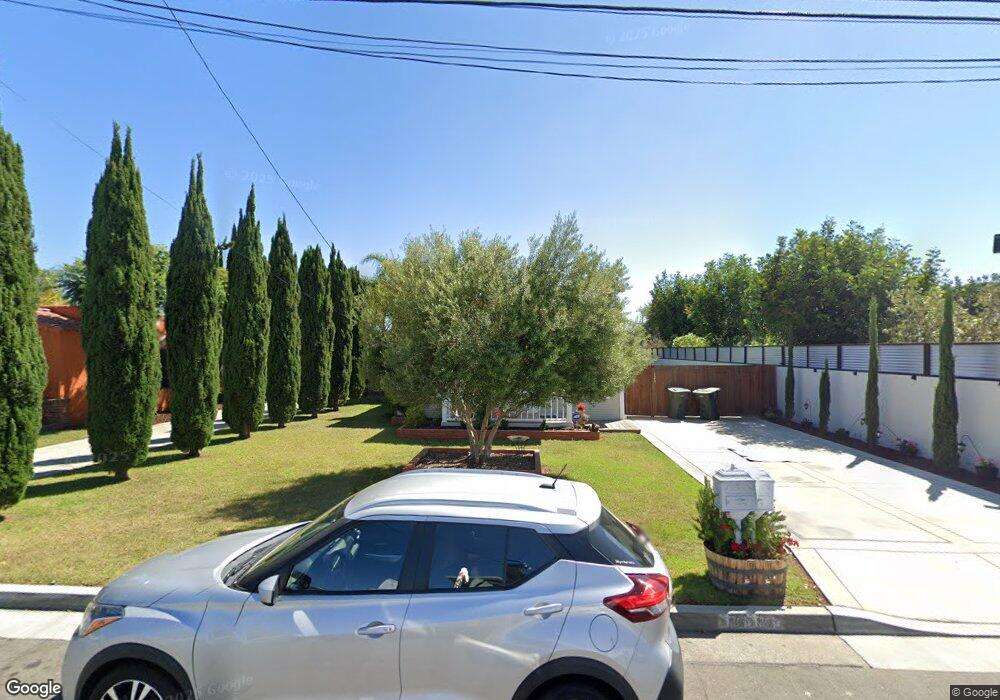
123 Virginia Place Costa Mesa, CA 92627
Eastside Costa Mesa NeighborhoodEstimated Value: $1,384,352 - $2,830,000
2
Beds
1
Bath
1,074
Sq Ft
$1,754/Sq Ft
Est. Value
About This Home
This home is located at 123 Virginia Place, Costa Mesa, CA 92627 and is currently estimated at $1,883,588, approximately $1,753 per square foot. 123 Virginia Place is a home located in Orange County with nearby schools including Heinz Kaiser Elementary School, Woodland Elementary School, and Horace Ensign Intermediate School.
Ownership History
Date
Name
Owned For
Owner Type
Purchase Details
Closed on
Oct 8, 2020
Sold by
Grams Beven Fritz and The Guenter A Grams Family Tru
Bought by
Grams Duane Otto
Current Estimated Value
Purchase Details
Closed on
Dec 14, 1998
Sold by
Bennett Mineeta M
Bought by
Grams Duane
Home Financials for this Owner
Home Financials are based on the most recent Mortgage that was taken out on this home.
Original Mortgage
$165,000
Interest Rate
6.63%
Mortgage Type
Seller Take Back
Purchase Details
Closed on
Jul 9, 1998
Sold by
Guenter Grams
Bought by
Grams Guenter A and Guenter A Grams Family Trust
Purchase Details
Closed on
Sep 18, 1996
Sold by
Guenter Grams and Guenter Mineeta M
Bought by
Grams Guenter A and Grams Mineeta M
Create a Home Valuation Report for This Property
The Home Valuation Report is an in-depth analysis detailing your home's value as well as a comparison with similar homes in the area
Home Values in the Area
Average Home Value in this Area
Purchase History
| Date | Buyer | Sale Price | Title Company |
|---|---|---|---|
| Grams Duane Otto | -- | None Available | |
| Grams Duane | $175,000 | Lawyers Title Company | |
| Bennett Mineeta M | -- | Lawyers Title Company | |
| Grams Guenter A | -- | -- | |
| Grams Guenter A | -- | -- | |
| Grams Guenter A | -- | -- | |
| Grams Guenter A | -- | -- |
Source: Public Records
Mortgage History
| Date | Status | Borrower | Loan Amount |
|---|---|---|---|
| Previous Owner | Grams Duane | $165,000 |
Source: Public Records
Tax History Compared to Growth
Tax History
| Year | Tax Paid | Tax Assessment Tax Assessment Total Assessment is a certain percentage of the fair market value that is determined by local assessors to be the total taxable value of land and additions on the property. | Land | Improvement |
|---|---|---|---|---|
| 2025 | $3,104 | $202,745 | $164,443 | $38,302 |
| 2024 | $3,104 | $198,770 | $161,219 | $37,551 |
| 2023 | $2,962 | $194,873 | $158,058 | $36,815 |
| 2022 | $2,802 | $191,052 | $154,958 | $36,094 |
| 2021 | $2,685 | $187,306 | $151,919 | $35,387 |
| 2020 | $2,645 | $185,386 | $150,361 | $35,025 |
| 2019 | $2,588 | $181,751 | $147,412 | $34,339 |
| 2018 | $2,537 | $178,188 | $144,522 | $33,666 |
| 2017 | $2,499 | $174,695 | $141,689 | $33,006 |
| 2016 | $2,451 | $171,270 | $138,911 | $32,359 |
| 2015 | $2,427 | $168,698 | $136,825 | $31,873 |
| 2014 | $2,376 | $165,394 | $134,145 | $31,249 |
Source: Public Records
Map
Nearby Homes
- 2214 Elden Ave
- 2336 Elden Ave Unit A
- 117 E Wilson St Unit C
- 184 E 21st St
- 2214 Rutgers Dr
- 2077 Tablelands Way
- 269 Cecil Place
- 2273 Columbia Dr
- 224 Pauline Place
- 273 Virginia Place
- 270 Albert Place
- 327 W Wilson St Unit 86
- 327 W Wilson St Unit 49
- 2060 Newport Blvd Unit 14
- 2383 Orange Ave
- 263 E 21st St
- 2173 Harmony Way
- 2334 Richmond Way
- 2330 Vanguard Way Unit F102
- 2330 Vanguard Way Unit L101
- 127 Virginia Place
- 126 22nd St Unit 2C
- 126 22nd St Unit 1A
- 112 22nd St
- 128 Virginia Place
- 120 Virginia Place Unit 102
- 120 Virginia Place
- 120 Virginia Place Unit 201
- 132 Virginia Place
- 2214 Newport Blvd
- 2214 Newport Blvd Unit 202
- 136 Virginia Place
- 133 Cecil Place Unit D
- 133 Cecil Place Unit F
- 133 Cecil Place Unit B
- 133 Cecil Place Unit E
- 133 Cecil Place Unit G
- 133 Cecil Place Unit C
- 133 Cecil Place Unit A
- 2209 Elden Ave