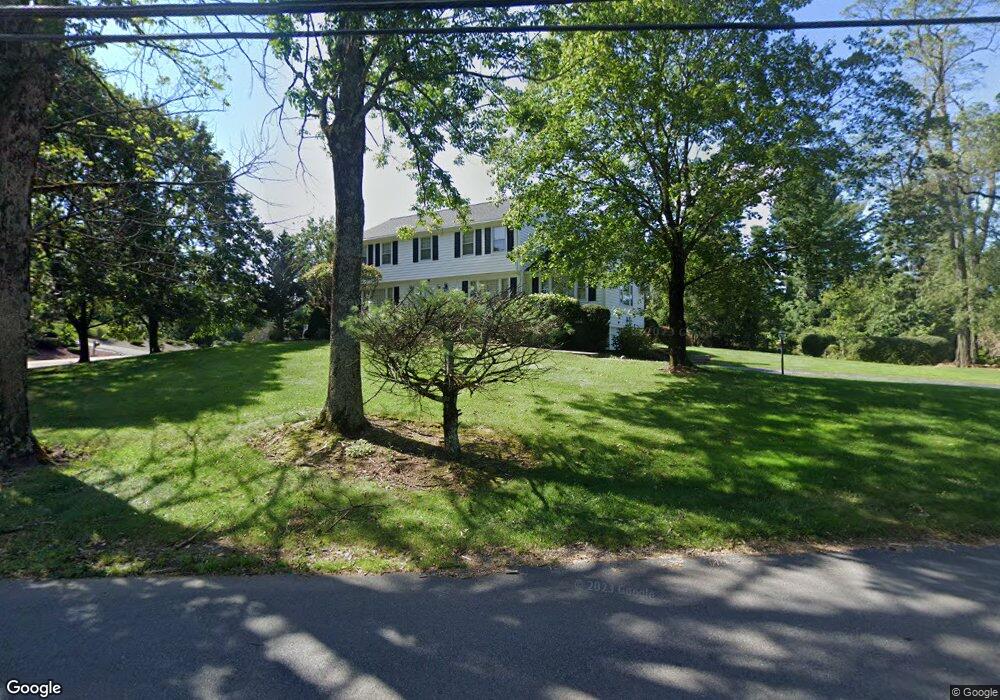
123 Woburn St Andover, MA 01810
Estimated Value: $1,074,000 - $1,412,000
4
Beds
3
Baths
3,023
Sq Ft
$397/Sq Ft
Est. Value
About This Home
This home is located at 123 Woburn St, Andover, MA 01810 and is currently estimated at $1,199,606, approximately $396 per square foot. 123 Woburn St is a home located in Essex County with nearby schools including South Elementary School, Doherty Middle School, and Andover High School.
Ownership History
Date
Name
Owned For
Owner Type
Purchase Details
Closed on
Dec 20, 2011
Sold by
Barbaro Ft and Barbaro
Bought by
123 Woburn Street Irt and Barbaro
Current Estimated Value
Purchase Details
Closed on
Sep 20, 2006
Sold by
Barbaro Gaspare and Barbaro Phyllis
Bought by
Barbaro Ft and Barbaro
Purchase Details
Closed on
Jul 30, 1987
Sold by
Kittleson Terry G
Bought by
Barbaro Gaspare
Home Financials for this Owner
Home Financials are based on the most recent Mortgage that was taken out on this home.
Original Mortgage
$153,100
Interest Rate
10.43%
Mortgage Type
Purchase Money Mortgage
Create a Home Valuation Report for This Property
The Home Valuation Report is an in-depth analysis detailing your home's value as well as a comparison with similar homes in the area
Home Values in the Area
Average Home Value in this Area
Purchase History
| Date | Buyer | Sale Price | Title Company |
|---|---|---|---|
| 123 Woburn Street Irt | -- | -- | |
| 123 Woburn Street Irt | -- | -- | |
| Barbaro Ft | -- | -- | |
| Barbaro Ft | -- | -- | |
| Barbaro Gaspare | $325,000 | -- |
Source: Public Records
Mortgage History
| Date | Status | Borrower | Loan Amount |
|---|---|---|---|
| Previous Owner | Barbaro Gaspare | $75,000 | |
| Previous Owner | Barbaro Gaspare | $153,100 | |
| Previous Owner | Barbaro Gaspare | $70,000 |
Source: Public Records
Tax History Compared to Growth
Tax History
| Year | Tax Paid | Tax Assessment Tax Assessment Total Assessment is a certain percentage of the fair market value that is determined by local assessors to be the total taxable value of land and additions on the property. | Land | Improvement |
|---|---|---|---|---|
| 2024 | $11,395 | $884,700 | $415,400 | $469,300 |
| 2023 | $10,920 | $799,400 | $374,200 | $425,200 |
| 2022 | $10,300 | $705,500 | $325,400 | $380,100 |
| 2021 | $9,880 | $646,200 | $295,600 | $350,600 |
| 2020 | $9,510 | $633,600 | $288,300 | $345,300 |
| 2019 | $9,474 | $620,400 | $279,800 | $340,600 |
| 2018 | $9,128 | $583,600 | $269,200 | $314,400 |
| 2017 | $8,771 | $577,800 | $263,900 | $313,900 |
| 2016 | $8,599 | $580,200 | $263,900 | $316,300 |
| 2015 | $8,283 | $553,300 | $253,700 | $299,600 |
Source: Public Records
Map
Nearby Homes
- 24 Enfield Dr
- 2 Clover Cir
- 40 Ballardvale Rd
- 3 West Hollow
- 56 Sunset Rock Rd
- 18 Boston Rd
- 18 Dale St Unit 4G
- 17 Linda Rd
- 21 Rocky Hill Rd
- 25 Timothy Dr
- 11 Gould Rd
- 331 S Main St
- 9 Flash Rd
- 4 Hazelwood Cir
- 50 Hidden Rd
- 4 Hammond Way
- 40 Colonial Dr Unit 8
- 20 Colonial Dr Unit 3
- 31 Porter Rd
- 1 Colonial Dr Unit C1-6